

Question: What information can be gained from cross-sectional comparables (Comps) analysis? The general economic condition. Industry wide performance O Forecasts of earnings. A company's relative position


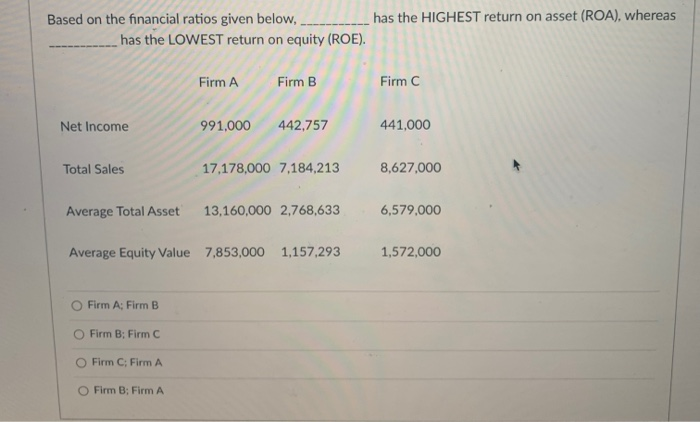
What information can be gained from cross-sectional comparables (Comps) analysis? The general economic condition. Industry wide performance O Forecasts of earnings. A company's relative position within its industry. 28 If a firm's return on equity is lower than investors' required rate of return, in order to maximize shareholder's wealth, the management team should: Retain 100% of earnings Payout 25% of earnings as dividend and retain the rest 75% O Payout 50% of earnings as dividend and retain the rest 50% O Payout 100% of earnings as dividend Based on the financial ratios given below, has the HIGHEST return on asset (ROA), whereas has the LOWEST return on equity (ROE). Firm A Firm B Firm Net Income 991,000 442,757 441,000 Total Sales 17,178,000 7,184,213 8,627,000 Average Total Asset 13,160,000 2,768,633 6,579,000 Average Equity Value 7,853,000 1,157,293 1,572,000 Firm A; Firm B Firm B; Firm C Firm C; Firm A O Firm B; Firm A
Step by Step Solution
There are 3 Steps involved in it

Get step-by-step solutions from verified subject matter experts