

Question: What input factor is driving the increase in the response variable in the diagram below? CoursHeroTranscribedText X = High Temp Y = Wall Thickness O
- What input factor is driving the increase in the response variable in the diagram below?
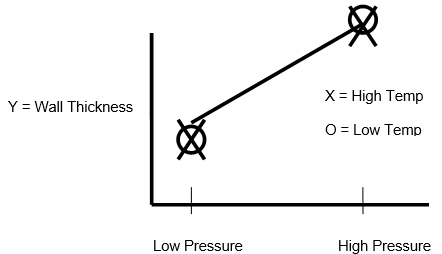
X = High Temp Y = Wall Thickness O = Low Temp Low Pressure High Pressure
Step by Step Solution
There are 3 Steps involved in it
1 Expert Approved Answer
Step: 1 Unlock

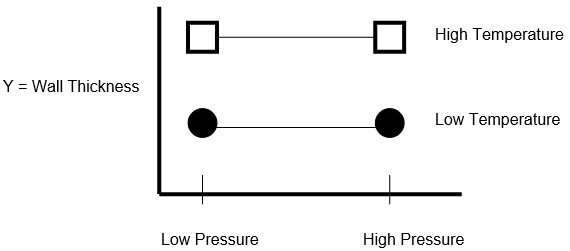
Solutions Step 1 The diagram presents a scenario with two independent variables temperature and pres... View full answer
Question Has Been Solved by an Expert!
Get step-by-step solutions from verified subject matter experts
Step: 2 Unlock
Step: 3 Unlock