

Question: What is a good estimate for the R2 value for the data represented in the scatterplot below? 22 20- Accidents per 100 drivers 12 10-
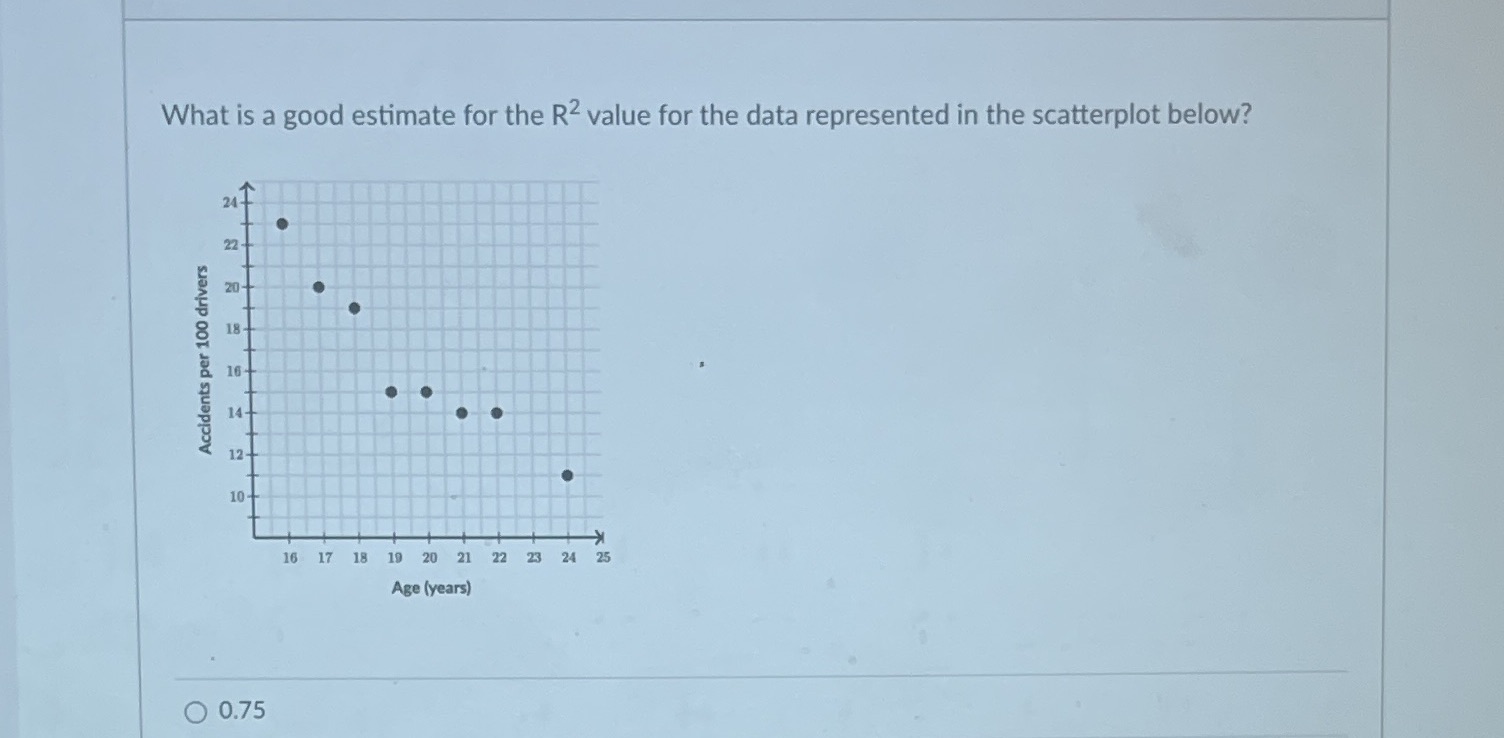
What is a good estimate for the R2 value for the data represented in the scatterplot below? 22 20- Accidents per 100 drivers 12 10- 16 17 18 19 20 21 22 23 24 25 K Age (years) O 0.75
Step by Step Solution
There are 3 Steps involved in it
1 Expert Approved Answer
Step: 1 Unlock

Question Has Been Solved by an Expert!
Get step-by-step solutions from verified subject matter experts
Step: 2 Unlock
Step: 3 Unlock