

Question: What is Data Visualization? Data Visualization tells us what to do. Data visualization combines data analysis with computer graphics to efficiently identify trends, patterns, relationships
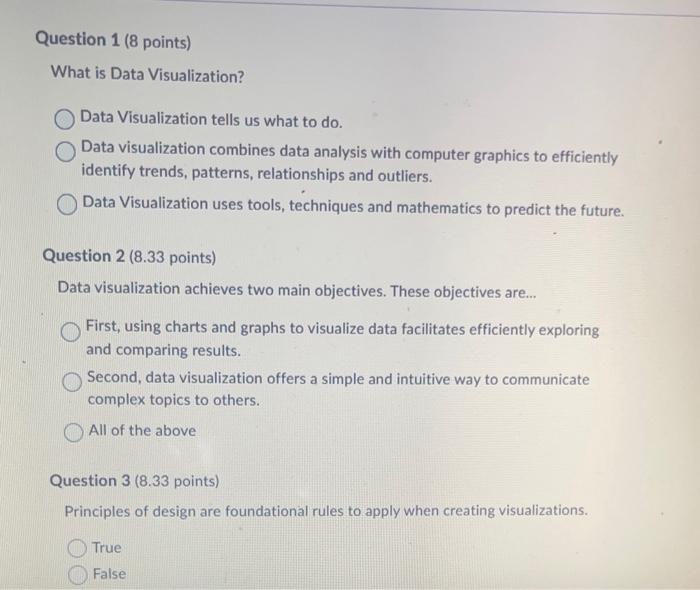
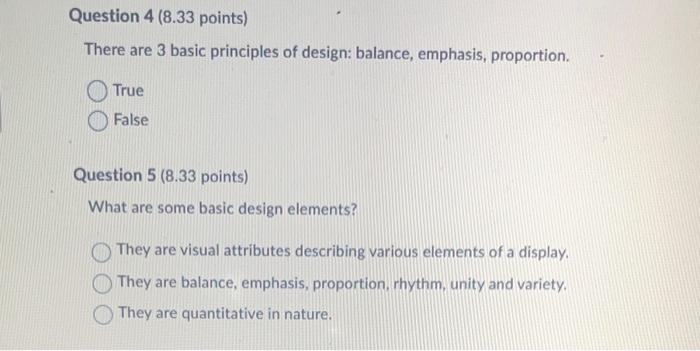
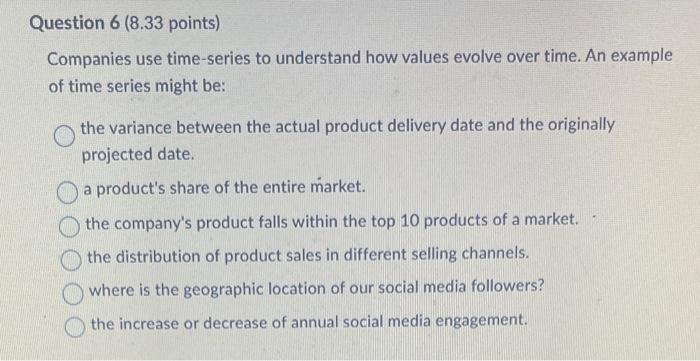
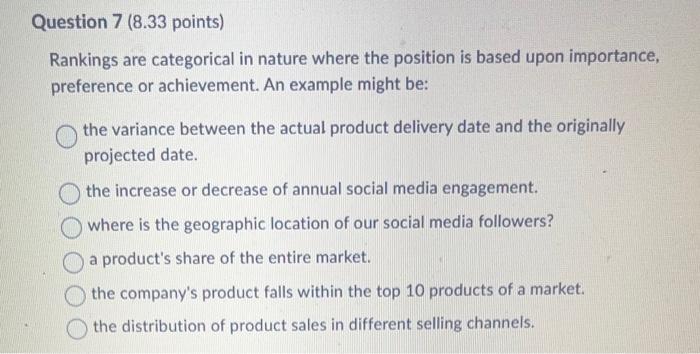
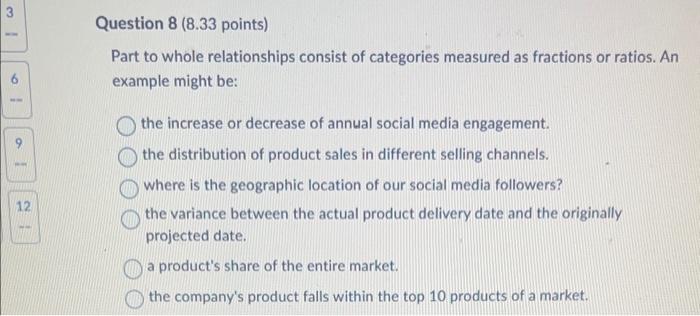
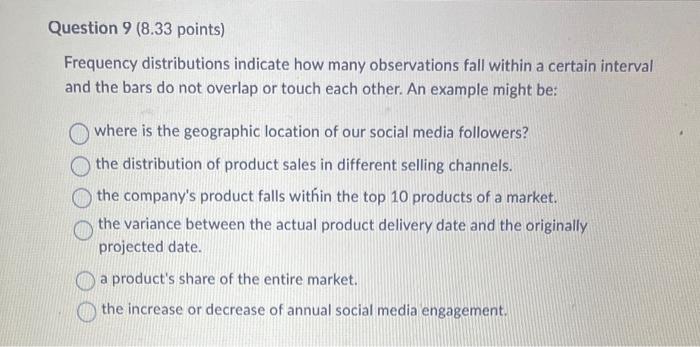
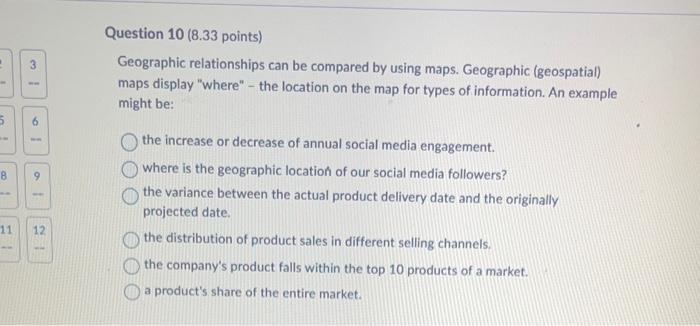
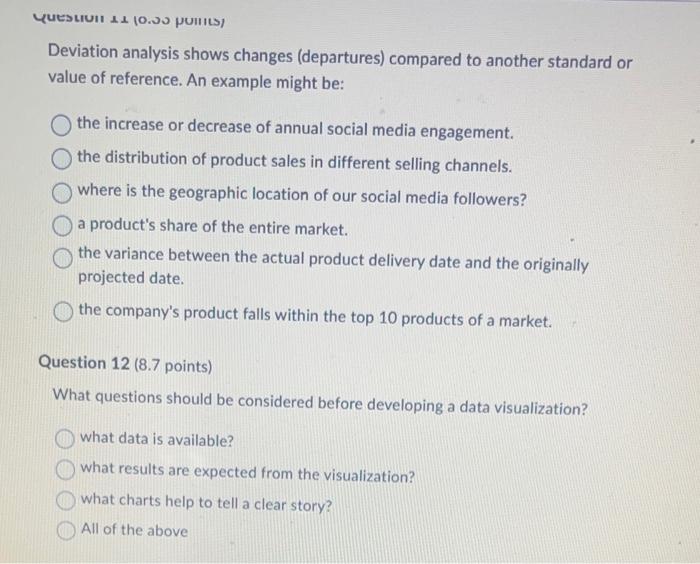
What is Data Visualization? Data Visualization tells us what to do. Data visualization combines data analysis with computer graphics to efficiently identify trends, patterns, relationships and outliers. Data Visualization uses tools, techniques and mathematics to predict the future. Question 2 ( 8.33 points) Data visualization achieves two main objectives. These objectives are... First, using charts and graphs to visualize data facilitates efficiently exploring and comparing results. Second, data visualization offers a simple and intuitive way to communicate complex topics to others. All of the above Question 3 (8.33 points) Principles of design are foundational rules to apply when creating visualizations. True False There are 3 basic principles of design: balance, emphasis, proportion. True False Question 5 ( 8.33 points) What are some basic design elements? They are visual attributes describing various elements of a display. They are balance, emphasis, proportion, rhythm, unity and variety. They are quantitative in nature. Companies use time-series to understand how values evolve over time. An example of time series might be: the variance between the actual product delivery date and the originally projected date. a product's share of the entire market. the company's product falls within the top 10 products of a market. the distribution of product sales in different selling channels. where is the geographic location of our social media followers? the increase or decrease of annual social media engagement. Rankings are categorical in nature where the position is based upon importance, preference or achievement. An example might be: the variance between the actual product delivery date and the originally projected date. the increase or decrease of annual social media engagement. where is the geographic location of our social media followers? a product's share of the entire market. the company's product falls within the top 10 products of a market. the distribution of product sales in different selling channels. Part to whole relationships consist of categories measured as fractions or ratios. An example might be: the increase or decrease of annual social media engagement. the distribution of product sales in different selling channels. where is the geographic location of our social media followers? the variance between the actual product delivery date and the originally projected date. a product's share of the entire market. the company's product falls within the top 10 products of a market. Frequency distributions indicate how many observations fall within a certain interval and the bars do not overlap or touch each other. An example might be: where is the geographic location of our social media followers? the distribution of product sales in different selling channels. the company's product falls within the top 10 products of a market. the variance between the actual product delivery date and the originally projected date. a product's share of the entire market. the increase or decrease of annual social media engagement. Geographic relationships can be compared by using maps. Geographic (geospatial) maps display "where" - the location on the map for types of information. An example might be: the increase or decrease of annual social media engagement. Where is the geographic location of our social media followers? the variance between the actual product delivery date and the originally projected date. the distribution of product sales in different selling channels. the company's product falls within the top 10 products of a market. a product's share of the entire market. Deviation analysis shows changes (departures) compared to another standard or value of reference. An example might be: the increase or decrease of annual social media engagement. the distribution of product sales in different selling channels. where is the geographic location of our social media followers? a product's share of the entire market. the variance between the actual product delivery date and the originally projected date. the company's product falls within the top 10 products of a market. Question 12 (8.7 points) What questions should be considered before developing a data visualization? what data is available? what results are expected from the visualization? what charts help to tell a clear story? All of the above
Step by Step Solution
There are 3 Steps involved in it

Get step-by-step solutions from verified subject matter experts