

Question: what is: Lower Control Limit (LCL;): If three standard deviations are used in the chart, what are the values of the control limits? Upper Control
what is:
Lower Control Limit (LCL;):
If three standard deviations are used in the chart,
what are the values of the control limits?
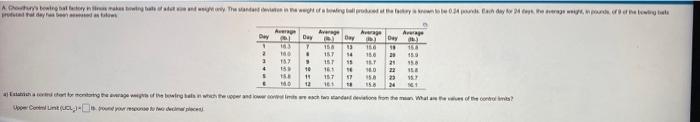
Upper Control Limit (UCL;)=
Lower Control Limit (LCL;) =
How do these values change?
A. The control limits for the 2-sigma -chart and
for the 3-sigmax-chart are the same.
B. The control limits are tighter for the 3-sigma X-
chart than for the 2-sigma &-chart.
C. The control limits are tighter for the 2-sigma X-
chart than for the 3-sigma x-chart.
Step by Step Solution
There are 3 Steps involved in it
1 Expert Approved Answer
Step: 1 Unlock

Question Has Been Solved by an Expert!
Get step-by-step solutions from verified subject matter experts
Step: 2 Unlock
Step: 3 Unlock