

Question: What is the additional financing that is needed by the company. Explain the formula you are using. According to the pro forma projection how much
What is the additional financing that is needed by the company.
Explain the formula you are using.
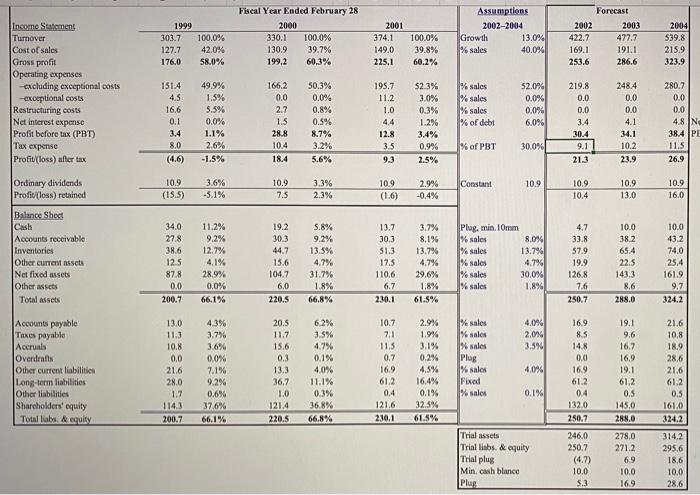
Fiscal Year Ended February 28 Assumptions Forecast Income Statement Turnover Cost of sales Gross profit Operating expenses -excluding exceptional costs -exceptional costs Restructuring costs Net interest expense Profit before tax (PBT) Tax expense Profit(loss) after tax 1999 2000 2001 2002-2004 2002 2003 2004 374.1 Growth % sales 13.0% 40.0% 303.7 100.0% 330.1 100.0% 100.0% 422.7 477.7 539.8 127.7 42.0% 130.9 39.7% 149.0 39.8% 169.1 191.1 215.9 176.0 58.0% 199,2 60,3% 225.1 60.2% 253.6 286.6 323.9 % sales % sales % sales % of debt 151.4 49.9% 166.2 50.3% 195.7 52.0% 0.0% 0.0% 6.0% 52.3% 219.8 248.4 280.7 4.5 1.5% 0.0 0.0% 11.2 3.0% 0.0 0.0 0.0 16.6 5.5% 2.7 0.8% 1.0 0.3% 0.0 0.0 0.0 0.1 0.0% 1.5 0.5% 4.4 1.2% 3.4 4.1 4.8 Ne 3.4 1.1% 28.8 8.7% 12.8 3.4% 30.4 34.1 38.4 PE 8.0 2.6% 10.4 3.2% 3.5 0.9% % of PBT 30.0% 10.2 11.5 9.1 (4.6) -1.5% 18.4 5.6% 9.3 2.5% 21.3 23.9 26.9 Ordinary dividends Profit(loss) retained 10.9 3.6% -5.1% 10.9 3.3% 2.3% 10.9 (1.6) 2.9% Constant 10.9 10,9 10.9 13.0 10.9 (15.5) 7.5 -0.4% 10.4 16.0 Balance Shect Cash Accounts receivable Inventories Plag, min. 10mm % sales % sales % sales % sales % sales 34.0 11.2% 19.2 S.8% 13.7 3.7% 4.7 10.0 10.0 30.3 44.7 15.6 104.7 8.0% 13.7% 4,7% 30.0% 1.8% 27.8 9.2% 9.2% 30.3 8.1% 33.8 38.2 43.2 38.6 12.7% 13.5% 51.3 13,7% 57.9 65.4 74.0 12.5 87.8 Other current assets 4.1% 4.7% 17.5 4.7% 19.9 22.5 25.4 Net fixed assets Other assets 28.9% 31.7% 110.6 29.6% 126.8 143.3 161.9 0.0 0.0% 6.0 1.8% 6.7 1.8% 1.6 8.6 9.7 Total assets 200.7 66.1% 220.5 66.8% 230.1 61.5% 250.7 288.0 324.2 2.9% % sales % sales % sales Plug % salos Fixed % salos 4.0% 2.0% 3.5% Accounts payable Taxes payable Accruals Overdrafts Other current liabilities Long-term liabilities Other liabilities Sharcholders' equity Total liabs. & equity 13.0 4.3% 20.5 6.2% 10.7 16.9 19.1 21.6 3.7% 3.6% 0.0% 11.3 11.7 3.5% 7.1 1.9% 8.5 9.6 10.8 4.7% 0.1% 4.0% 11.5 3.1% 0.2% 10.8 15.6 14.8 16.7 18.9 16.9 19.1 0.7 0.0 28.6 21.6 0.0 0.3 4.0% 16.9 61.2 21.6 4,5% 16.9 7.1% 9.2% 0.6% 37.6% 66.1% 13.3 28.0 16.4% 0.1% 32.5% 36.7 11.1% 61.2 61.2 61.2 1.7 1.0 0.3% 0.4 0.1% 0.4 0.5 0.5 121.6 161.0 132.0 250.7 114.3 121.4 36.8% 145.0 200.7 220.5 66.8% 230.1 61.5% 288.0 324.2 Trial assets Trial liabs. & equity Trial plug Min. cash blance Plug 246.0 278.0 314.2 250.7 271.2 295.6 (4.7) 6.9 18.6 10,0 10.0 10.0 5.3 16.9 28.6
Step by Step Solution
3.51 Rating (154 Votes )
There are 3 Steps involved in it
Additional funds needed is the difference in Total assets minus Total liabilities a... View full answer

Get step-by-step solutions from verified subject matter experts