

Question: What is the answer? 3. The table sets out an economy's aggregate demand (AD), aggregate supply schedules (SAS) and the Long Run Aggregate Supply (LAS).
What is the answer?
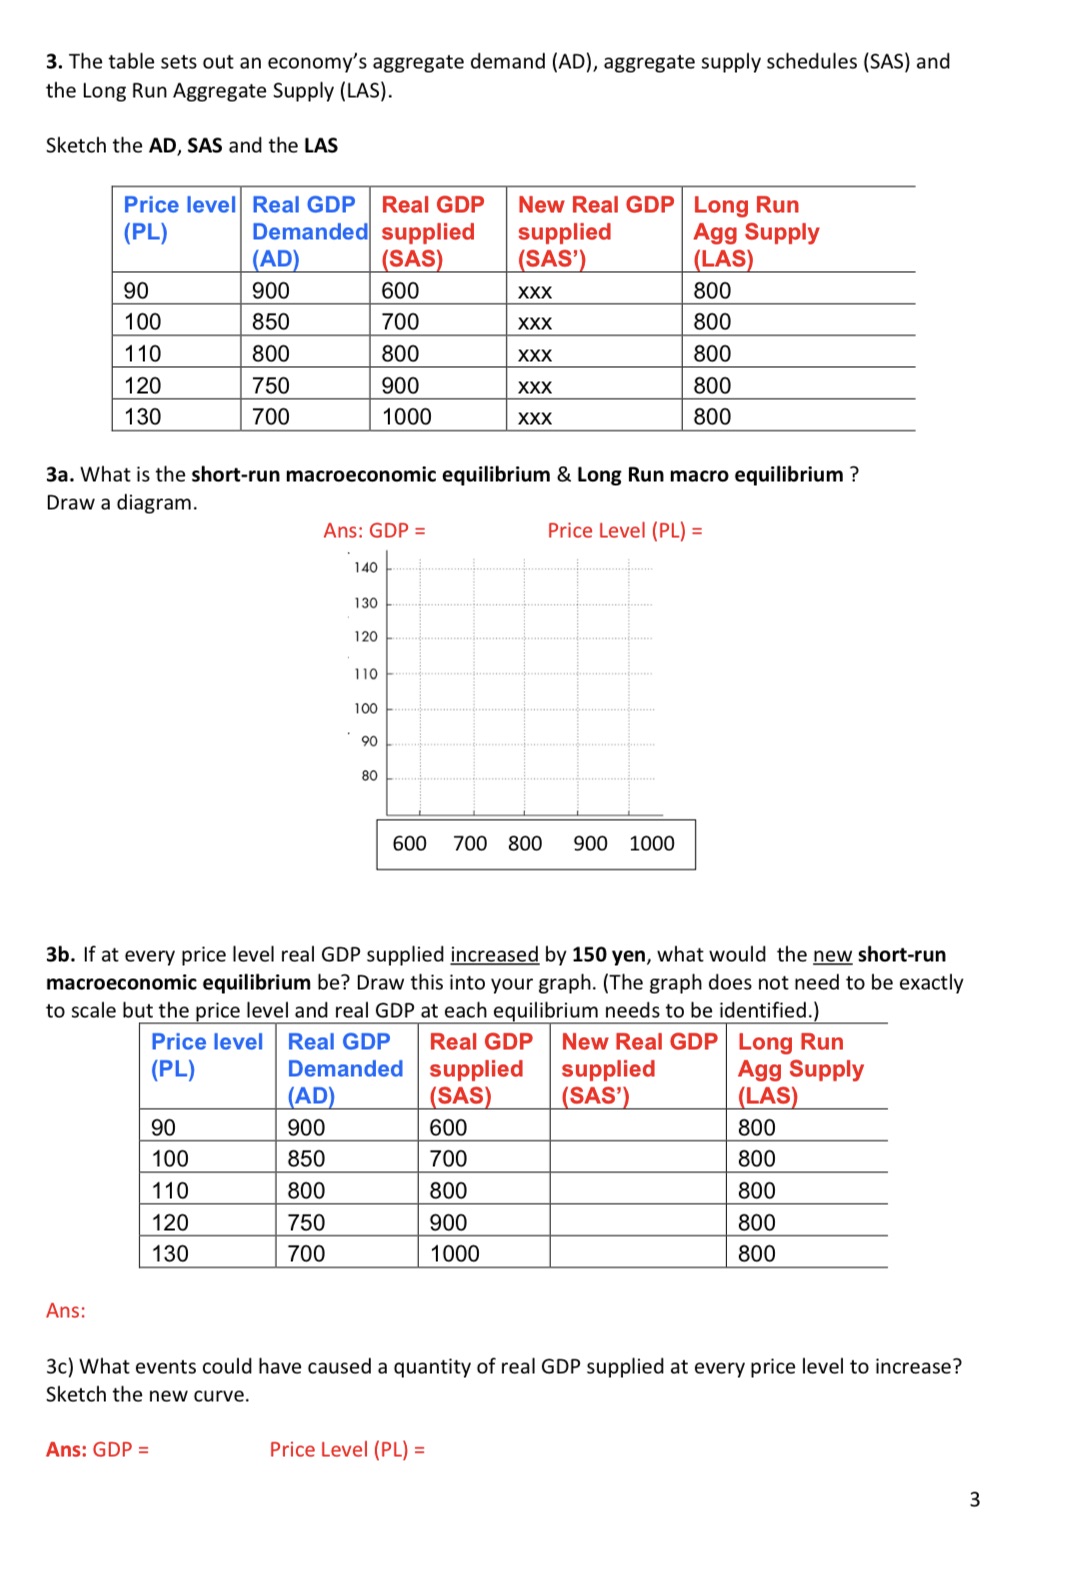
3. The table sets out an economy's aggregate demand (AD), aggregate supply schedules (SAS) and the Long Run Aggregate Supply (LAS). Sketch the AD, SAS and the LAS Price level Real GDP Real GDP New Real GDP Long Run (PL) Demanded supplied supplied Agg Supply (AD) SAS (SAS' (LAS) 90 900 600 XXX 800 100 850 700 XXX 800 110 800 800 XXX 800 120 750 900 XXX 800 130 700 1000 XXX 800 3a. What is the short-run macroeconomic equilibrium & Long Run macro equilibrium ? Draw a diagram. Ans: GDP = Price Level (PL) = 140 130 120 110 100 90 80 600 700 800 900 1000 3b. If at every price level real GDP supplied increased by 150 yen, what would the new short-run macroeconomic equilibrium be? Draw this into your graph. (The graph does not need to be exactly to scale but the price level and real GDP at each equilibrium needs to be identified.) Price level Real GDP Real GDP New Real GDP| Long Run (PL) Demanded supplied supplied Agg Supply (AD (SAS (SAS') (LAS 90 900 600 800 100 850 700 800 110 800 800 800 120 750 900 800 130 700 1000 800 Ans: 3c) What events could have caused a quantity of real GDP supplied at every price level to increase? Sketch the new curve. Ans: GDP = Price Level (PL) = 3
Step by Step Solution
There are 3 Steps involved in it

Get step-by-step solutions from verified subject matter experts