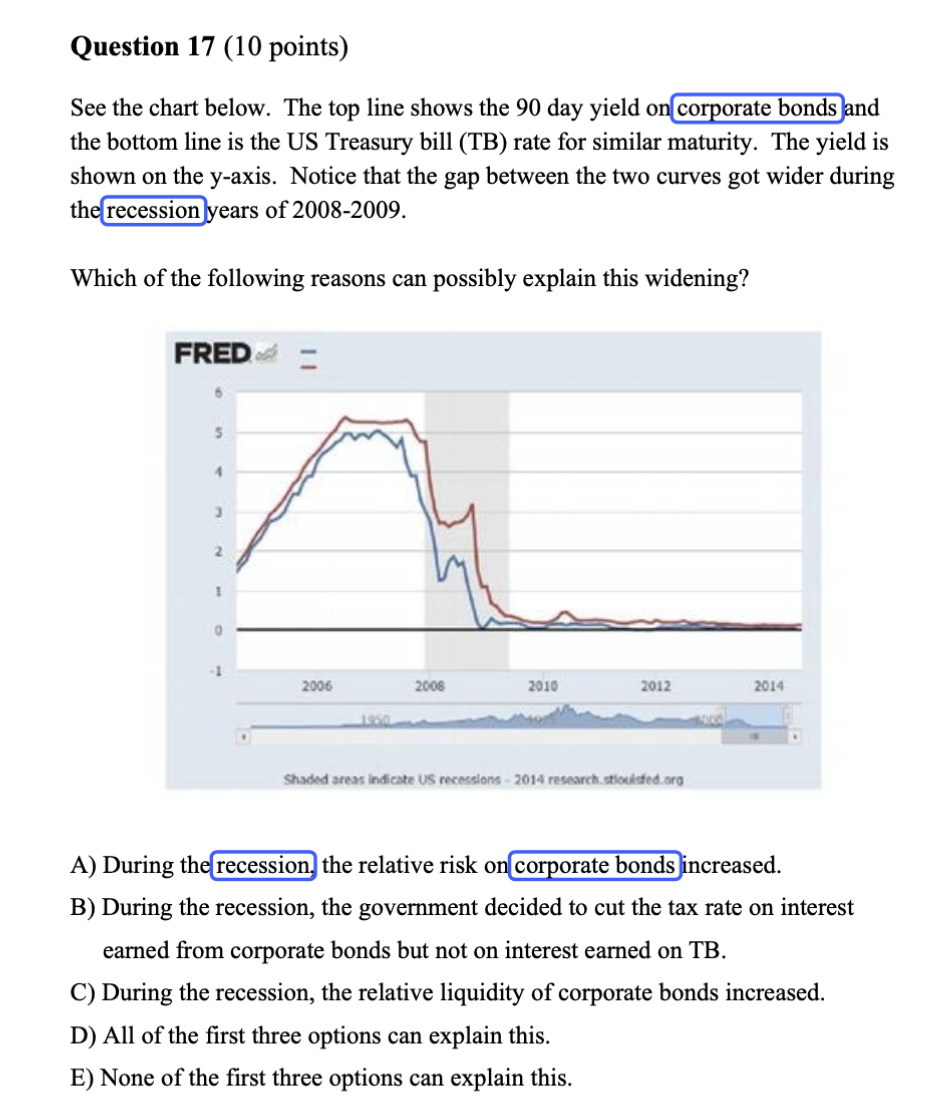
Question: What is the answer Question 17 (10 points) See the chart below. The top line shows the 90 day yield on{corporate bonds jand the bottom

What is the answer

What is the answer Question 17 (10 points) See
Question 17 (10 points) See the chart below. The top line shows the 90 day yield on{corporate bonds jand the bottom line is the US Treasury bill (TB) rate for similar maturity. The yield is shown on the y-axis. Notice that the gap between the two curves got wider during thejrecession}years of 2008-2009. Which of the following reasons can possibly explain this widening? 2006 2008 2010 2012 2014 Shaded areat indicate US recessions 2014 research, ticuicted org A) During the recession] the relative risk on ncreased. B) During the recession, the government decided to cut the tax rate on interest earned from corporate bonds but not on interest earned on TB. C) During the recession, the relative liquidity of corporate bonds increased. D) All of the first three options can explain this. E) None of the first three options can explain this

Step by Step Solution

There are 3 Steps involved in it

1 Expert Approved Answer
Step: 1 Unlock blur-text-image
Question Has Been Solved by an Expert!

Get step-by-step solutions from verified subject matter experts

Step: 2 Unlock
Step: 3 Unlock

Students Have Also Explored These Related Accounting Questions!