

Question: What is the answer to the question below? 4. Now construct a histogram of the data above, using your calculator, by following the directions below:
What is the answer to the question below?
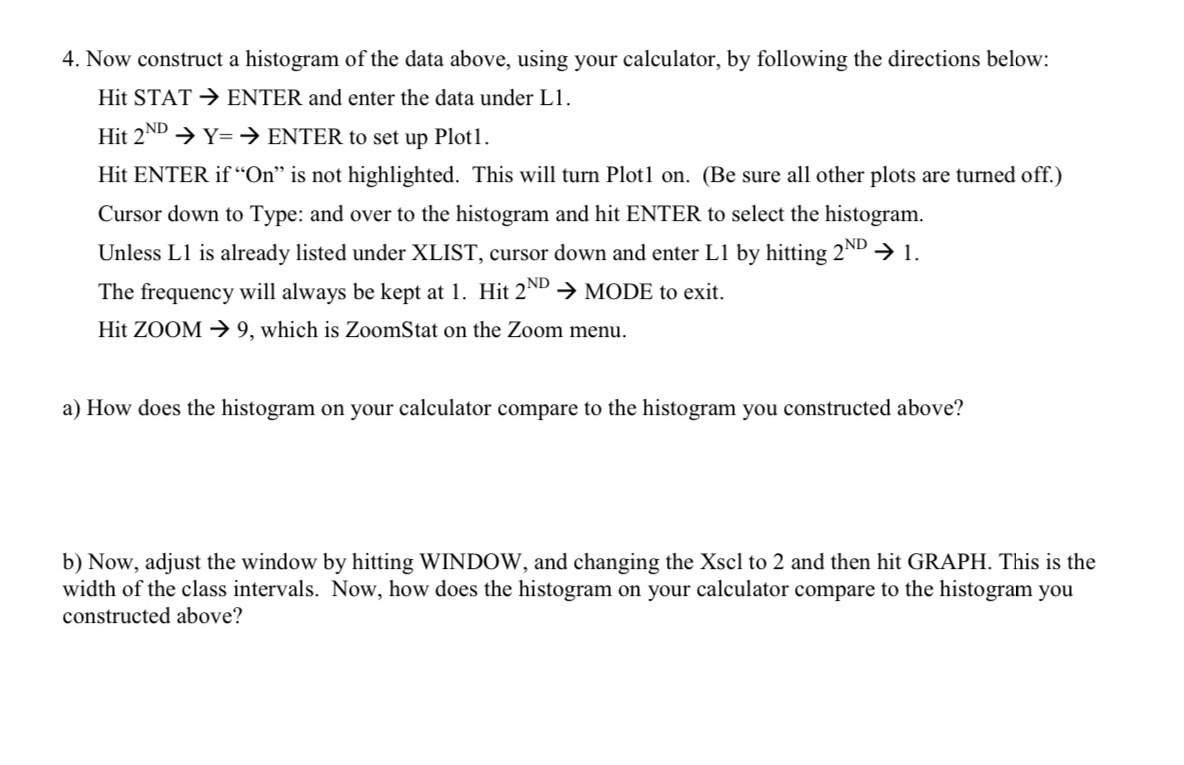
4. Now construct a histogram of the data above, using your calculator, by following the directions below: Hit STAT 9 ENTER and enter the data under Ll. Hit 2\"\" -) Y= ) ENTER to set up Plotl. Hit ENTER if \"On" is not highlighted. This will turn Plotl on. (Be sure all other plots are turned off.) Cursor down to Type: and over to the histogram and hit ENTER to select the histogram. Unless L1 is already listed under XLIST, cursor down and enter Ll by hitting 2ND 9 l. The frequency will always be kept at 1. Hit 2ND 9 MODE to exit. Hit ZOOM 9 9, which is ZoomStat on the Zoom menu. a) How does the histogram on your calculator compare to the histogram you constructed above? b) Now, adjust the window by hitting WINDOW, and changing the Xscl to 2 and then hit GRAPH. This is the width of the class intervals. Now, how does the histogram on your calculator compare to the histogram you constructed above
Step by Step Solution
There are 3 Steps involved in it

Get step-by-step solutions from verified subject matter experts