

Question: What is the answer to this question? Selected comparative financial statements of Korbin Company follow. blom 17-2A los, common size tements, and trend cents P2
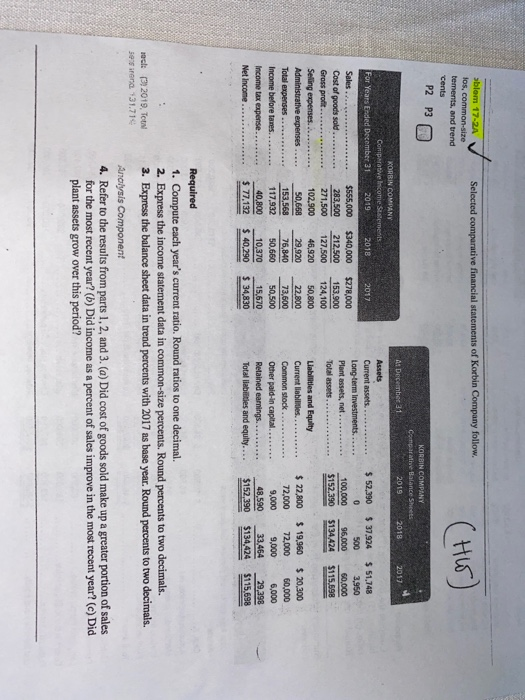
Selected comparative financial statements of Korbin Company follow. blom 17-2A los, common size tements, and trend cents P2 P3 (HE) KORBIN COMPANY Comparative Balance Sheets 2019 2018 Af December 31 2017 KORBIN COMPANY Comparative Income Statements For Years Ended December 31 2019 2018 2017 Sales. Assets Current assets. Long-term Investments Plant assets, net. Total assets.. $ 52,390 0 100,000 $152,390 $ 37,924 500 96,000 $134.424 $ 51,748 3,950 60,000 $115.598 Cost of goods sold Gross profit... Selling expenses. Administrative expenses. Total expenses... Income before taves Income tax expense... Net Income $555,000 283,500 271,500 102.900 50,668 153,568 117,932 40.800 $ 77,132 $340,000 212,500 127,500 46,920 29,920 76,840 50.660 10,370 $ 40,290 $278,000 153,900 124,100 50.800 22.800 73,600 50,500 15,670 $ 34,830 Liabilities and Equity Current liabilities. Common stock Other paid-in capital Retained earnings.. Total liabilities and equity.... $ 22,800 72,000 9,000 48,590 $152,390 $ 19,960 72,000 9,000 33.464 $134,424 $ 20,300 60,000 6,000 29,298 $115.698 ac (3) 2019. Tot 50 ron 31.71 Required 1. Compute each year's current ratio. Round ratios to one decimal. 2. Express the income statement data in common-size percents. Round percents to two decimals. 3. Express the balance sheet data in trend percents with 2017 as base year. Round percents to two decimals. Analysis Component 4. Refer to the results from parts 1, 2 and 3. (a) Did cost of goods sold make up a greater portion of sales for the most recent year? (b) Did income as a percent of sales improve in the most recent year? (c) Did plant assets grow over this period
Step by Step Solution
There are 3 Steps involved in it

Get step-by-step solutions from verified subject matter experts