

Question: What is the approximate correlation of the data plotted below? y 10 . .. 5 O -15 -50 0 5 10 15 -5 -10 O
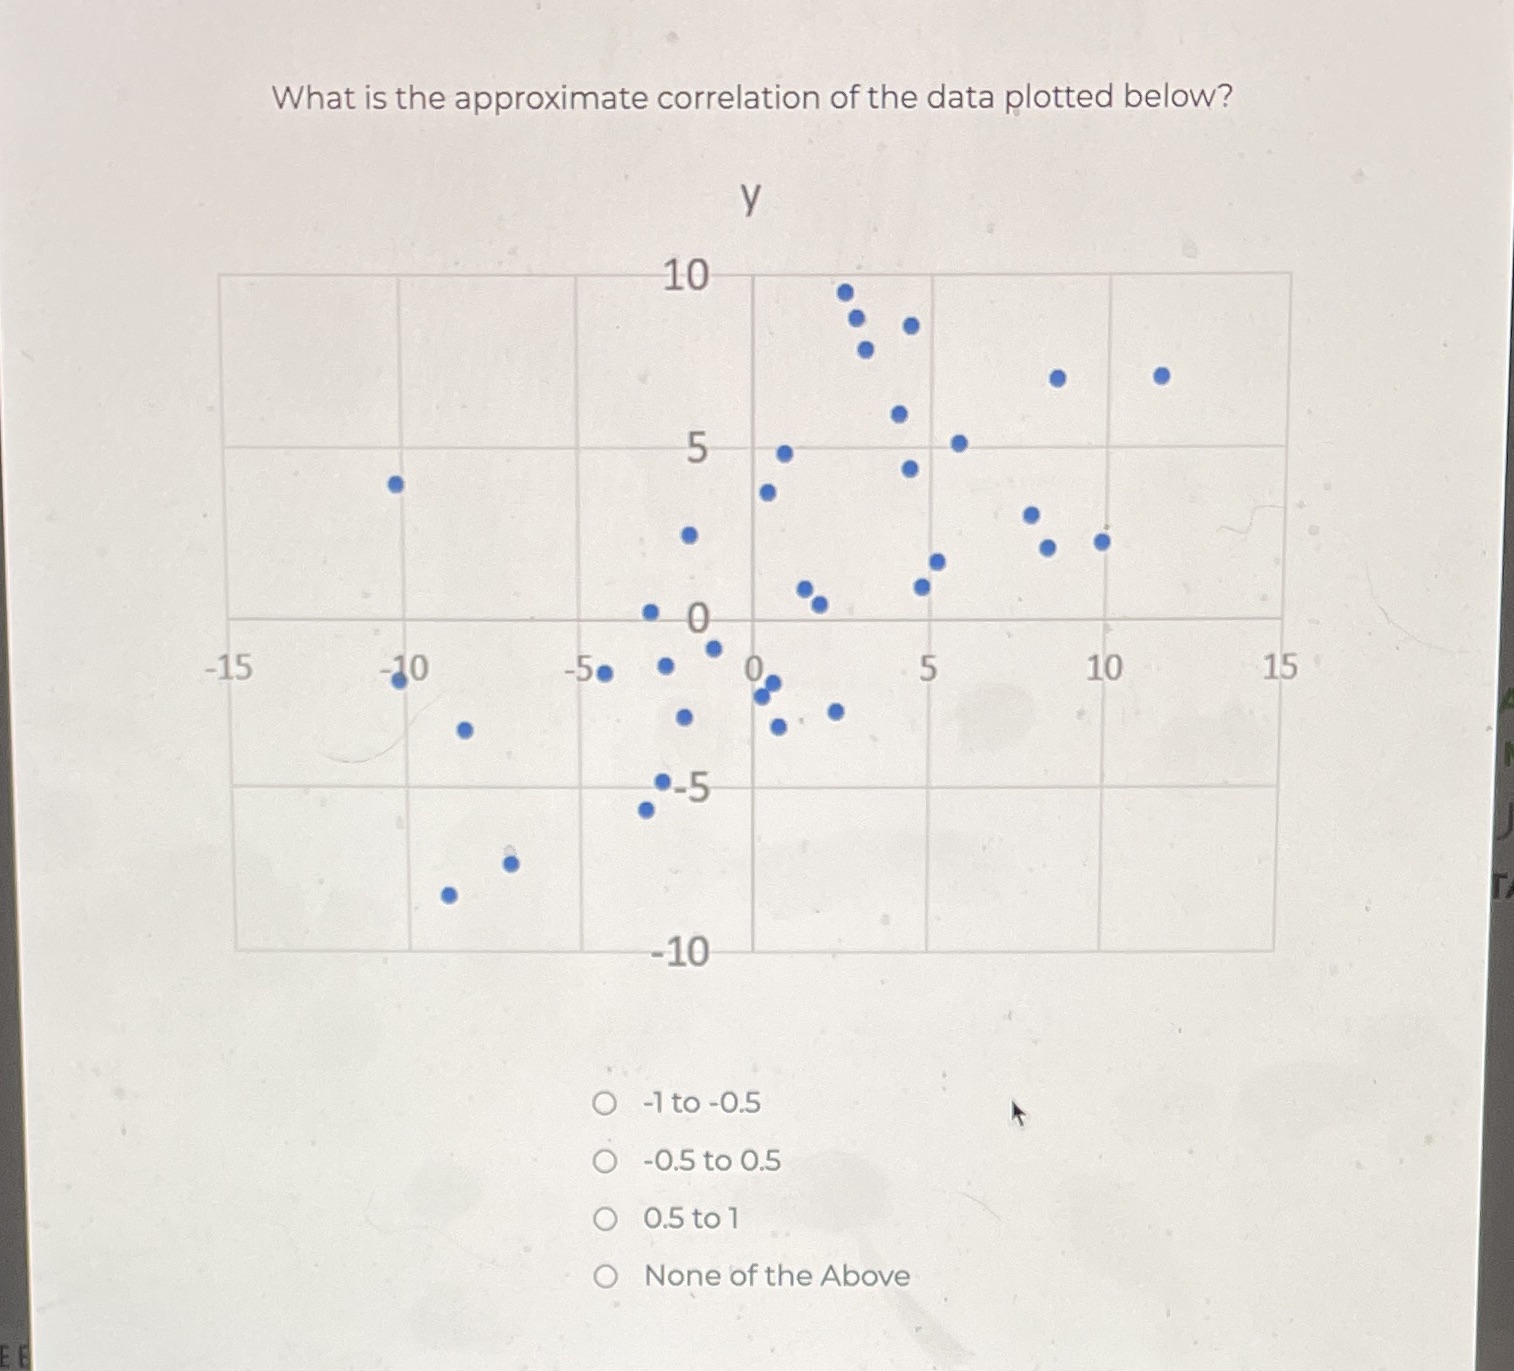
What is the approximate correlation of the data plotted below? y 10 . .. 5 O -15 -50 0 5 10 15 -5 -10 O -1 to -0.5 O -0.5 to 0.5 O 0.5 to 1 None of the Above
Step by Step Solution
There are 3 Steps involved in it
1 Expert Approved Answer
Step: 1 Unlock

Question Has Been Solved by an Expert!
Get step-by-step solutions from verified subject matter experts
Step: 2 Unlock
Step: 3 Unlock