

Question: What is the best way to visualize a data where there are 4 features that are boolean (2 value categorical) and the target variable is
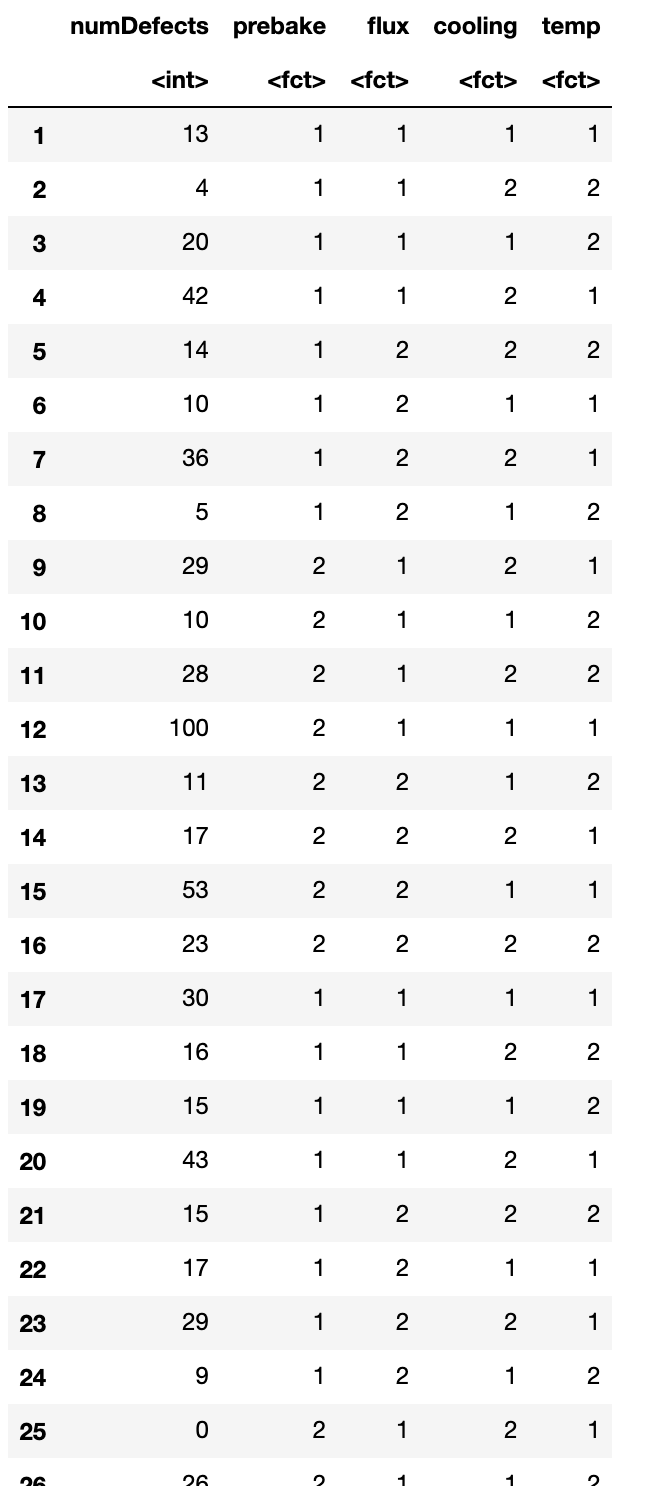
What is the best way to visualize a data where there are 4 features that are boolean (2 value categorical) and the target variable is number? I've attached how the data look like. I am using R.
Step by Step Solution
There are 3 Steps involved in it
1 Expert Approved Answer
Step: 1 Unlock

Question Has Been Solved by an Expert!
Get step-by-step solutions from verified subject matter experts
Step: 2 Unlock
Step: 3 Unlock