

Question: The figure above shows the log of UK real GDP per capita between 1875 and 1914. Which of the following is correct? Log of
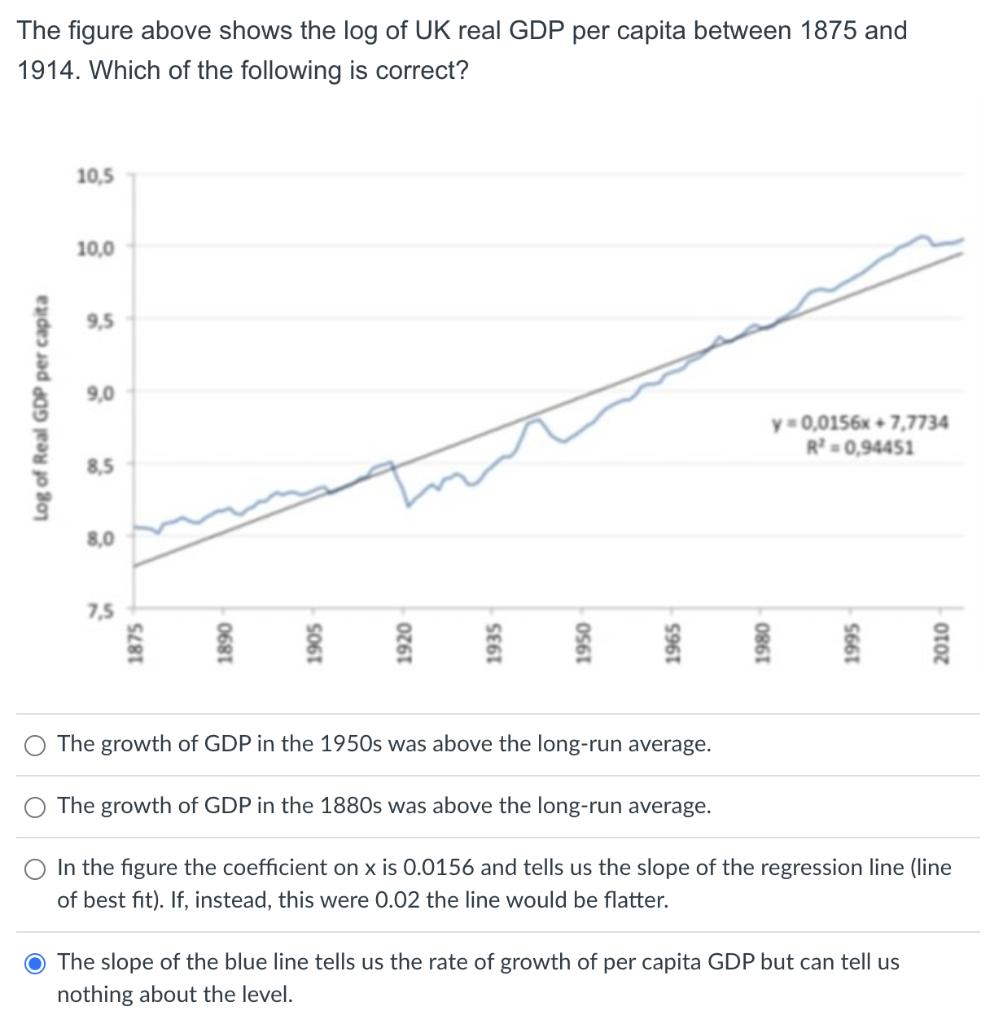
The figure above shows the log of UK real GDP per capita between 1875 and 1914. Which of the following is correct? Log of Real GDP per capita 10,5 10,0 9,5 9,0 8,5 8,0 7,5 1875 1890 1905 1920 1935 1950 1965 1980 y=0,0156x +7,7734 R = 0,94451 5661 2010 O The growth of GDP in the 1950s was above the long-run average. O The growth of GDP in the 1880s was above the long-run average. In the figure the coefficient on x is 0.0156 and tells us the slope of the regression line (line of best fit). If, instead, this were 0.02 the line would be flatter. The slope of the blue line tells us the rate of growth of per capita GDP but can tell us nothing about the level.
Step by Step Solution
3.44 Rating (167 Votes )
There are 3 Steps involved in it
Based on the information given in the image the correct answer i... View full answer

Get step-by-step solutions from verified subject matter experts