

Question: What is the correct answer can you explain thankYou so much The scatter plot at the right suggests a linear relationship between time spent line?
What is the correct answer can you explain thankYou so much
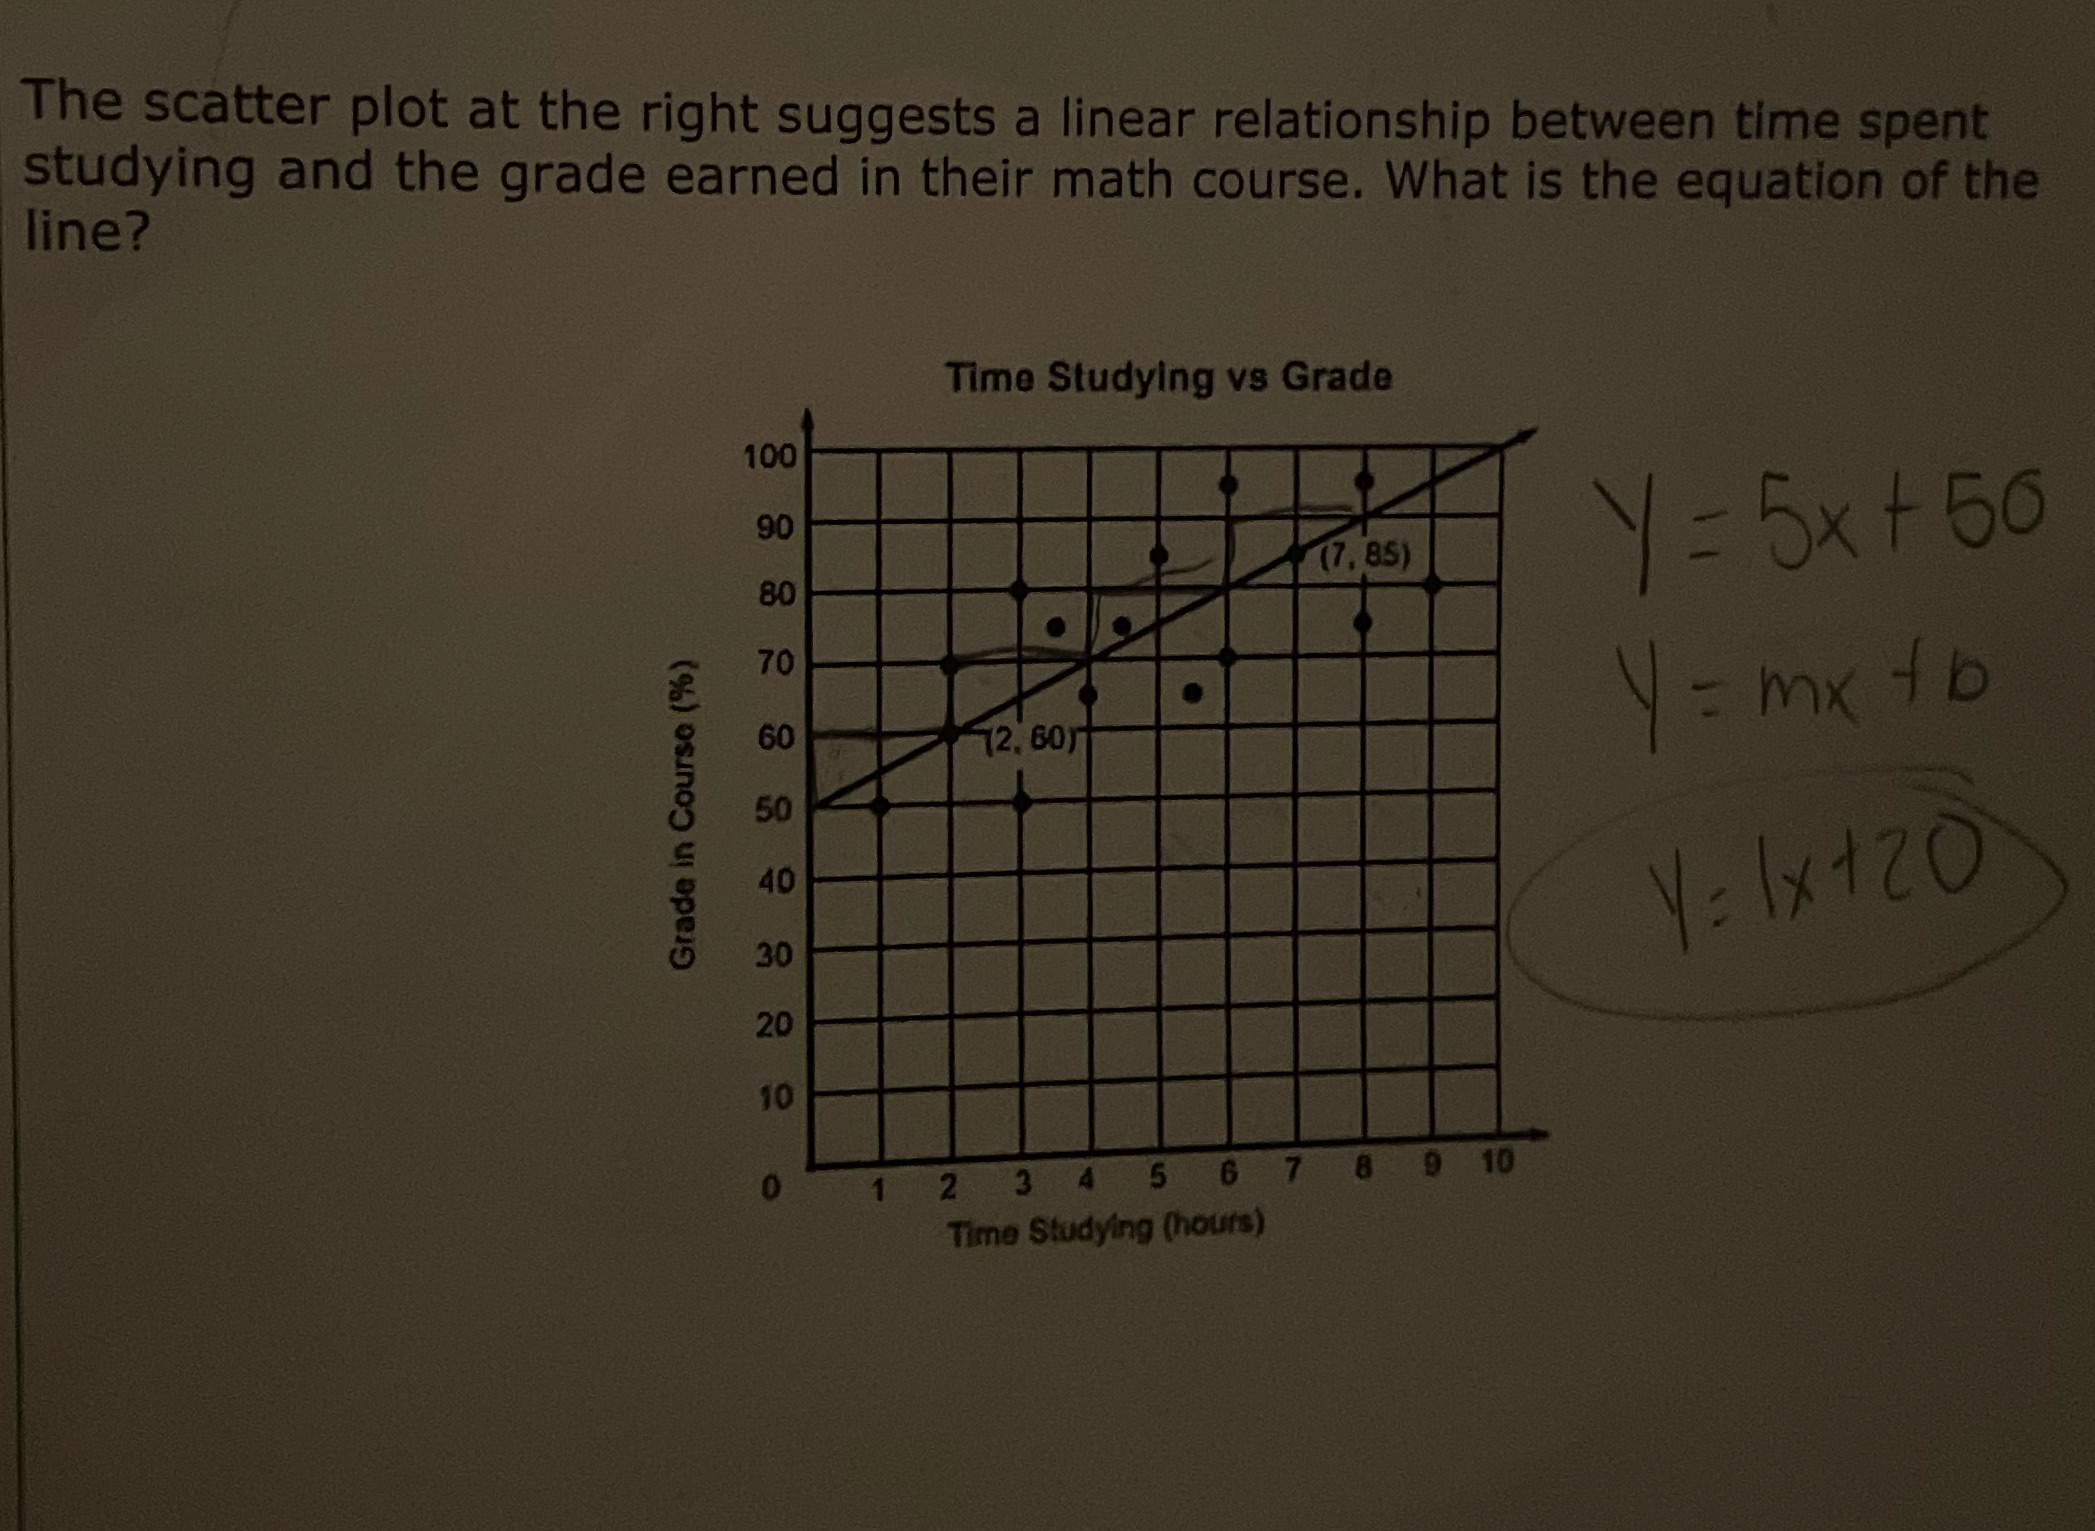
The scatter plot at the right suggests a linear relationship between time spent line? studying and the grade earned in their math course. What is the equation of the Time Studying vs Grade 100 90 (7, 85) y = 5 x+50 72. 60) y = mix to 8 8 : 8 8 8 8 Grade in Course (%) Y= 1x +20 10 O 2 4 5 7 8 9 10 Time Studying (hours)
Step by Step Solution
There are 3 Steps involved in it
1 Expert Approved Answer
Step: 1 Unlock

Question Has Been Solved by an Expert!
Get step-by-step solutions from verified subject matter experts
Step: 2 Unlock
Step: 3 Unlock