

Question: what is the correct answer Maximize Z = 81x 1 + 73x 2 + 69x 3 subject to: 0.06 y 1 + 460y 2 +
 what is the correct answer
Maximize Z = 81x1 + 73x2 + 69x3
subject to:
0.06 y1 + 460y2 + 13.1y3 = 1
86x1 + 75x2 + 71x3 0.06y1 + 260y2 + 11.3y3
82x1 + 72x2 + 67x3 0.05y1 + 320y2 + 10.5y3
81x1 + 79x2 + 80x3 0.08y1 + 340y2 + 12.0y3
81x1 + 73x2 + 69x3 0.06y1 + 460y2 + 13.1y3
xi, yi 0
Maximize Z = 82x1 + 72x2 + 67x3
subject to:
0.05 y1 + 320y2 + 10.5y3 = 1
86x1 + 75x2 + 71x3 0.06y1 + 260y2 + 11.3y3
82x1 + 72x2 + 67x3 0.05y1 + 320y2 + 10.5y3
81x1 + 79x2 + 80x3 0.08y1 + 340y2 + 12.0y3
81x1 + 73x2 + 69x3 0.06y1 + 460y2 + 13.1y3
xi, yi 0
Maximize Z = 81x1 + 73x2 + 69x3
subject to:
0.08 y1 + 340y2 + 12y3 = 1
86x1 + 75x2 + 71x3 0.06y1 + 260y2 + 11.3y3
82x1 + 72x2 + 67x3 0.05y1 + 320y2 + 10.5y3
81x1 + 79x2 + 80x3 0.08y1 + 340y2 + 12.0y3
81x1 + 73x2 + 69x3 0.06y1 + 460y2 + 13.1y3
xi, yi 0
Maximize Z = 81x1 + 79x2 + 80x3
subject to:
0.08 y1 + 340y2 + 12y3 = 1
86x1 + 75x2 + 71x3 0.06y1 + 260y2 + 11.3y3
82x1 + 72x2 + 67x3 0.05y1 + 320y2 + 10.5y3
81x1 + 79x2 + 80x3 0.08y1 + 340y2 + 12.0y3
81x1 + 73x2 + 69x3 0.06y1 + 460y2 + 13.1y3
xi, yi 0
None of the above
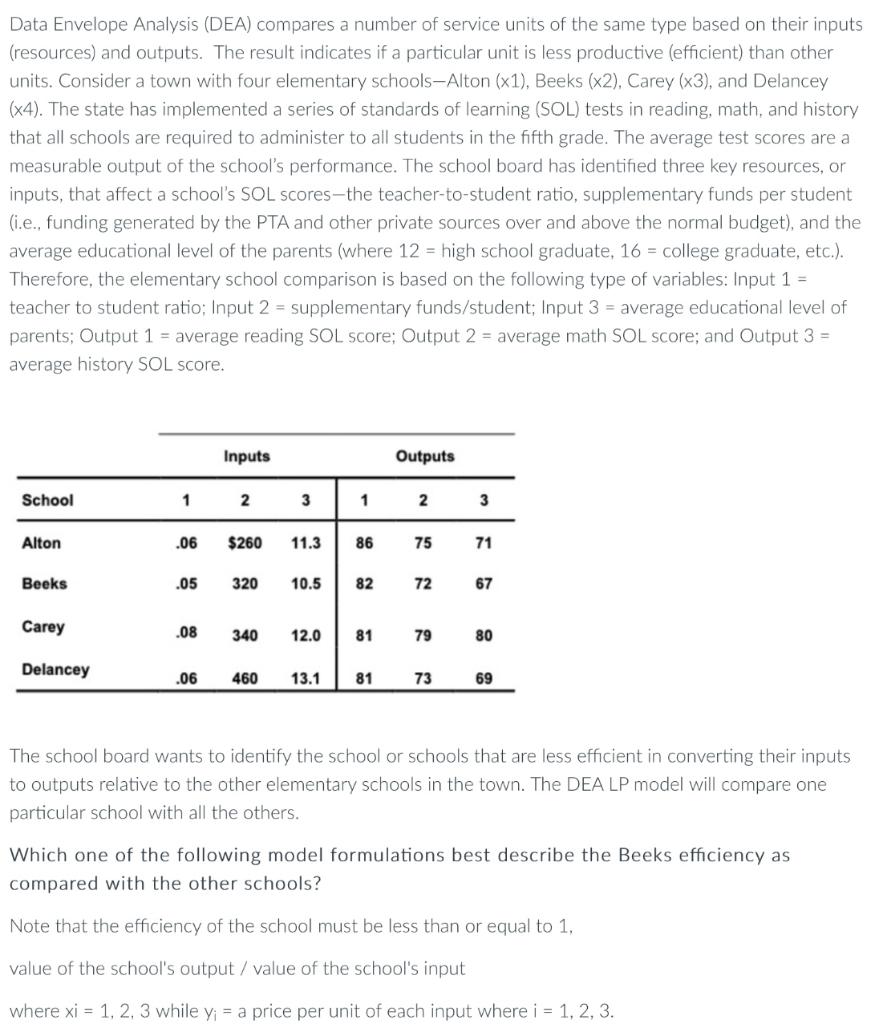
Data Envelope Analysis (DEA) compares a number of service units of the same type based on their inputs (resources) and outputs. The result indicates if a particular unit is less productive (efficient) than other units. Consider a town with four elementary schools-Alton ( x1 ), Beeks ( x2), Carey ( x3), and Delancey (x4). The state has implemented a series of standards of learning (SOL) tests in reading, math, and history that all schools are required to administer to all students in the fifth grade. The average test scores are a measurable output of the school's performance. The school board has identified three key resources, or inputs, that affect a school's SOL scores-the teacher-to-student ratio, supplementary funds per student (i.e., funding generated by the PTA and other private sources over and above the normal budget), and the average educational level of the parents (where 12 = high school graduate, 16= college graduate, etc.). Therefore, the elementary school comparison is based on the following type of variables: Input 1= teacher to student ratio; Input 2 = supplementary funds/student; Input 3 = average educational level of parents; Output 1 = average reading SOL score; Output 2 = average math SOL score; and Output 3 = average history SOL score. The school board wants to identify the school or schools that are less efficient in converting their inputs to outputs relative to the other elementary schools in the town. The DEA LP model will compare one particular school with all the others. Which one of the following model formulations best describe the Beeks efficiency as compared with the other schools? Note that the efficiency of the school must be less than or equal to 1 , value of the school's output / value of the school's input where xi=1,2,3 while yi= a price per unit of each input where i=1,2,3. Data Envelope Analysis (DEA) compares a number of service units of the same type based on their inputs (resources) and outputs. The result indicates if a particular unit is less productive (efficient) than other units. Consider a town with four elementary schools-Alton ( x1 ), Beeks ( x2), Carey ( x3), and Delancey (x4). The state has implemented a series of standards of learning (SOL) tests in reading, math, and history that all schools are required to administer to all students in the fifth grade. The average test scores are a measurable output of the school's performance. The school board has identified three key resources, or inputs, that affect a school's SOL scores-the teacher-to-student ratio, supplementary funds per student (i.e., funding generated by the PTA and other private sources over and above the normal budget), and the average educational level of the parents (where 12 = high school graduate, 16= college graduate, etc.). Therefore, the elementary school comparison is based on the following type of variables: Input 1= teacher to student ratio; Input 2 = supplementary funds/student; Input 3 = average educational level of parents; Output 1 = average reading SOL score; Output 2 = average math SOL score; and Output 3 = average history SOL score. The school board wants to identify the school or schools that are less efficient in converting their inputs to outputs relative to the other elementary schools in the town. The DEA LP model will compare one particular school with all the others. Which one of the following model formulations best describe the Beeks efficiency as compared with the other schools? Note that the efficiency of the school must be less than or equal to 1 , value of the school's output / value of the school's input where xi=1,2,3 while yi= a price per unit of each input where i=1,2,3
Step by Step Solution
There are 3 Steps involved in it

Get step-by-step solutions from verified subject matter experts