Question: what is the correct answer? What do you see on the range chart? Return to the chart in Figure 11-8. Is this process stable? Explain.

what is the correct answer? What do you see on the range chart?

what is the correct answer? What do you see on

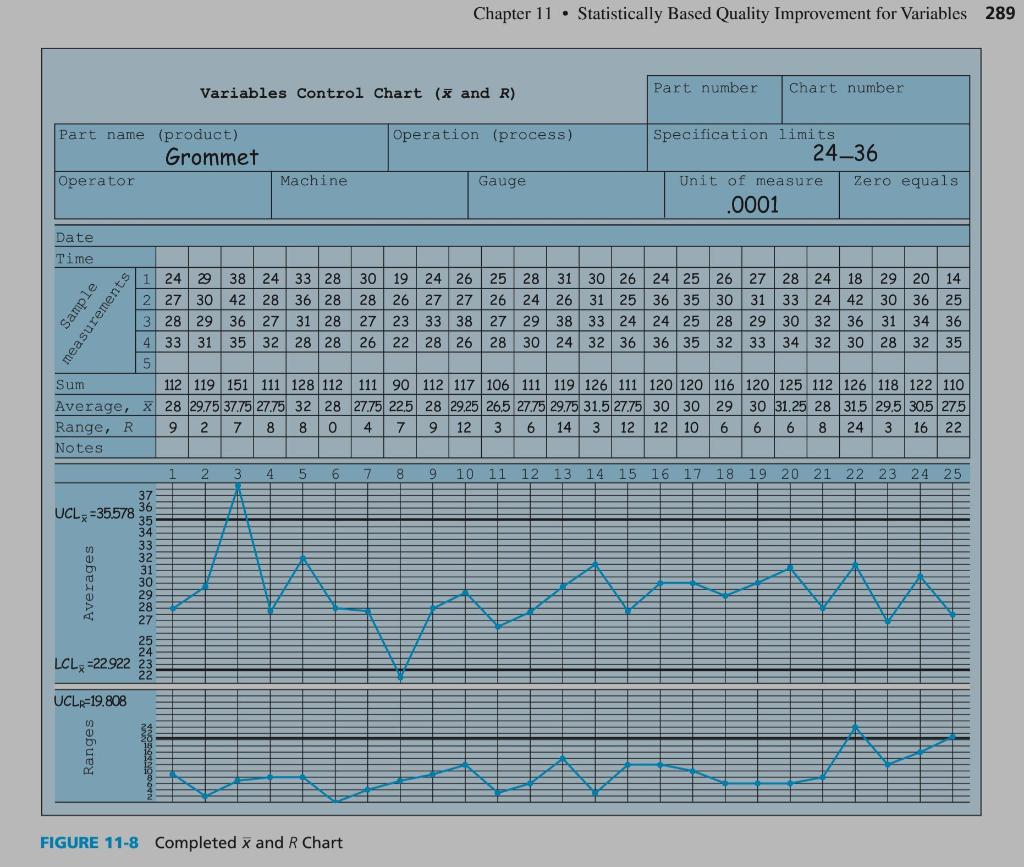
Return to the chart in Figure 11-8. Is this process stable? Explain. Don't forget to look at the range
Not Stable, 3 and 8 are out of the control. (explain more)
Chapter 11 . Statistically Based Quality Improvement for Variables 289 Variables Control Chart (x and R) Part number Chart number Operation (process) Part name (product) Grommet Operator Specification limits 24-36 Unit of measure Zero equals .0001 Machine Gauge Date Time 1 2429 38 24 33 28 30 19 24 26 25 28 31 30 26 24 25 26 27 28 24 18 29 29 2014 2 27 30 42 28 36 28 28 26 27 27 26 24 26 31 25 36 35 30 31 33 24 42 30 30 36 25 3 28 29 36 27 31 28 27 23 33 38 27 29 38 33 24 24 25 28 29 30 32 36 31 31 34 36 4 33 31 35 32 28 28 26 22 28 26 28 26 22 28 26 28 30 24 32 36 30 24 32 36 36 35 32 33 34 32 30 28 32 35 5 Sum 112 119 151 111 128 112 111 90 112 117 106 111 119 126 111 120 120 116 120 125 112 126 118 122 110 Average, X 28 2975 37.75 27.75 32 28 27.75 22.5 28 29.25 265 27.75 29.75 31.5 27.75 30 30 29 30 31.25 28 31.5 29.5 30.5 27.5 Range, R 9 9 2 7 8 8 0 4 7 9 12 3 6 14 3 12 12 10 6 6 6 8 24 6 3 16 22 Notes Sample measurements 1 2 3 4 5 6 7 8 9 10 11 12 13 14 15 16 17 18 19 20 21 22 23 24 25 JA 37 36 UCL=35578 35 34 33 32 31 30 29 28 27 Averages 25 24 LCL =22922 23 22 UCLR=19.808 28 Ranges NORINO FIGURE 11-8 Completed x and R Chart

Step by Step Solution

There are 3 Steps involved in it

1 Expert Approved Answer
Step: 1 Unlock blur-text-image
Question Has Been Solved by an Expert!

Get step-by-step solutions from verified subject matter experts

Step: 2 Unlock
Step: 3 Unlock

Students Have Also Explored These Related General Management Questions!