

Question: What is the debt service coverage ratio? First two pics is balance statements. cash flows last pic September 30 2003 2002 Assets Current assets: Cash
What is the debt service coverage ratio?
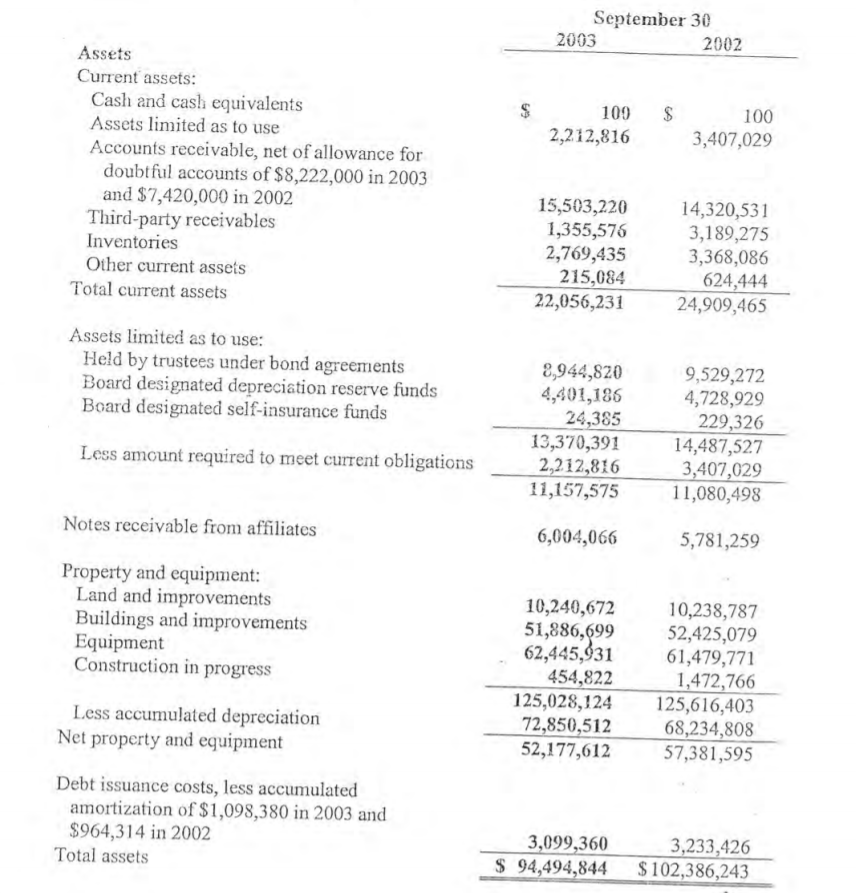
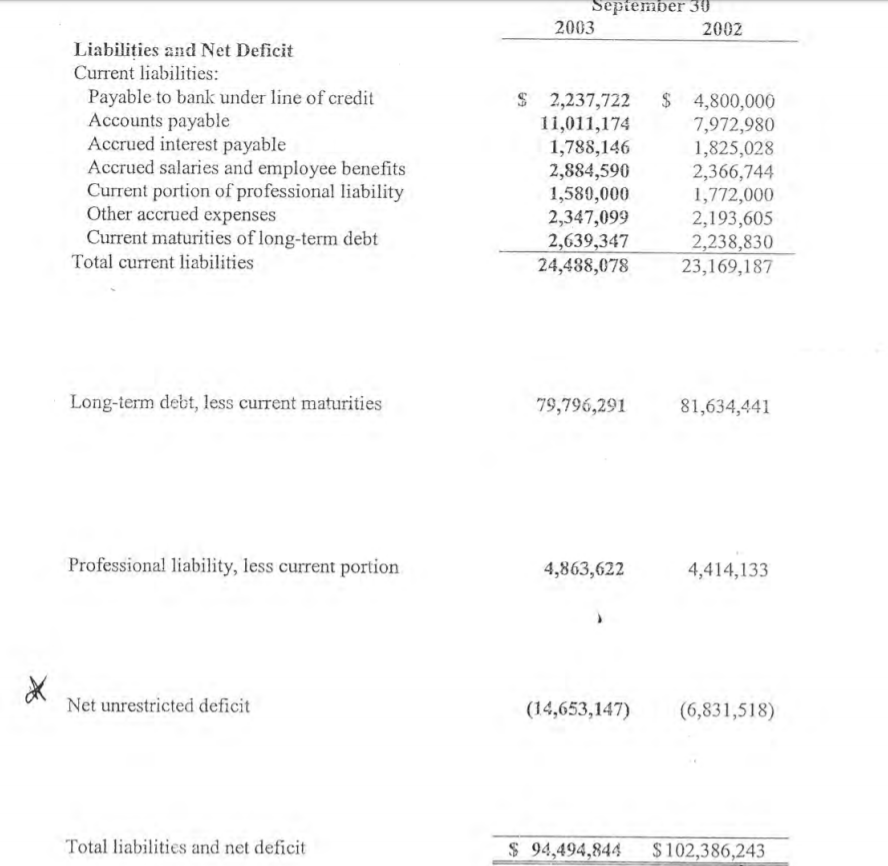
First two pics is balance statements.
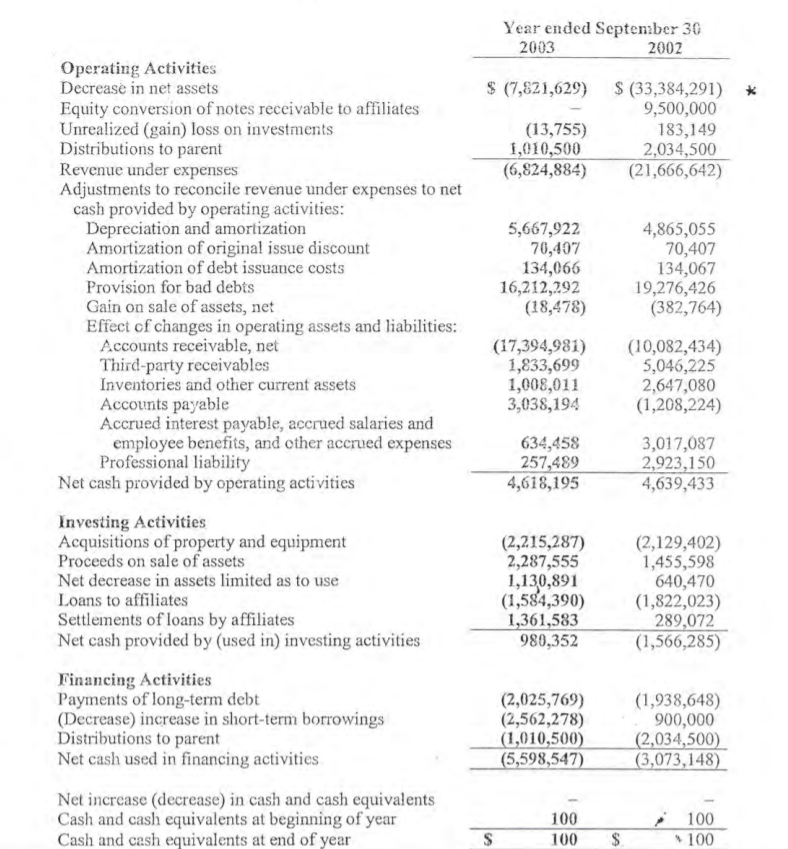
cash flows last pic
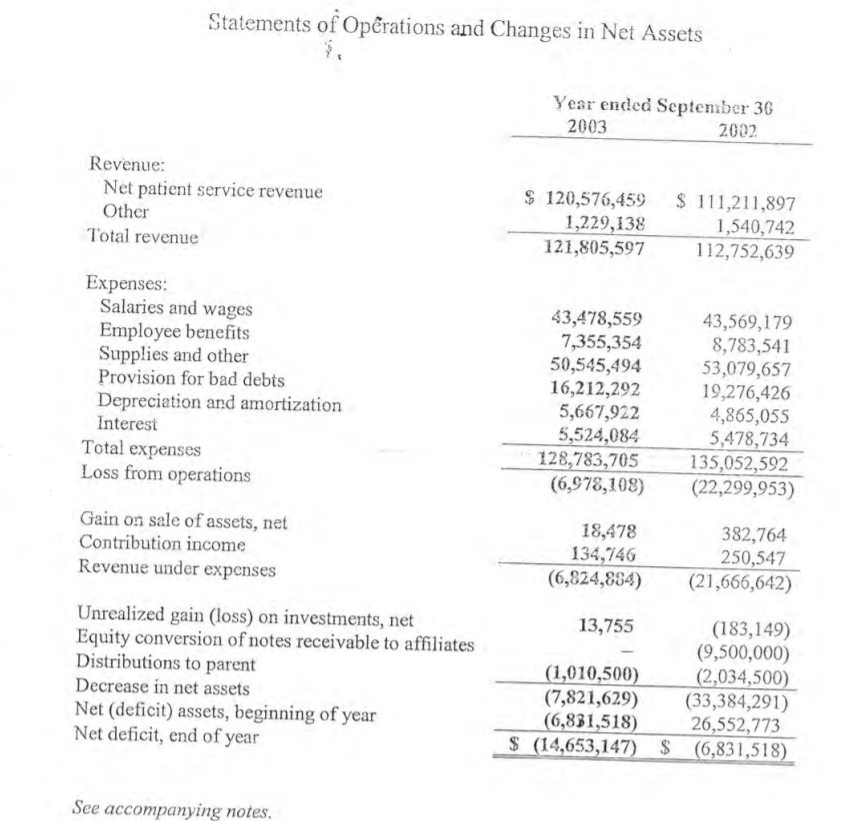
September 30 2003 2002 Assets Current assets: Cash and cash equivalents Assets limited as to use 2$ 2,212,816 109 100 3,407,029 Accounts receivable, net of allowance for doubtful accounts of $8,222,000 in 2003 and $7,420,000 in 2002 Third-party receivables Inventories Other current assets 15,503,220 1,355,576 2,769,435 215,084 22,056,231 14,320,531 3,189,275 3,368,086 624,444 24,909,465 Total current assets Assets limited as to use: Held by trustees under bond agreements Board designated depreciation reserve funds Board designated self-insurance funds 8,944,820 4,401,186 24,385 13,370,391 2,212,816 11,157,575 9,529,272 4,728,929 229,326 14,487,527 3,407,029 11,080,498 Less amount required to meet current obligations Notes receivable from affiliates 6,004,066 5,781,259 Property and equipment: Land and improvements Buildings and improvements Equipment Construction in progress 10,240,672 51,886,699 62,445,931 454,822 125,028,124 72,850,512 52,177,612 10,238,787 52,425,079 61,479,771 1,472,766 125,616,403 68,234,808 57,381,595 Less accumulated depreciation Net property and equipment Debt issuance costs, less accumulated amortization of $1,098,380 in 2003 and $964,314 in 2002 Total assets 3,099,360 $ 94,494,844 3,233,426 $102,386,243 September 30 2002 2003 Liabiliies and Net Deficit Current liabilities: Payable to bank under line of credit Accounts payable Accrued interest payable Accrued salaries and employee benefits Current portion of professional liability Other accrued expenses Current maturities of long-term debt $ 2,237,722 11,011,174 1,788,146 2,884,590 1,589,000 2,347,099 2,639,347 24,488,078 $ 4,800,000 7,972,980 1,825,028 2,366,744 1,772,000 2,193,605 2,238,830 23,169,187 Total current liabilities Long-term debt, less current maturities 79,796,291 81,634,441 Professional liability, less current portion 4,863,622 4,414,133 Net unrestricted deficit (14,653,147) (6,831,518) Total liabilities and net deficit $ 94,494,844 $102,386,243 Statements of Operations and Changes in Net Assets Year ended September 36 2003 2002 Revenue: Net patient service revenue Other $ 120,576,459 1,229,138 121,805,597 $ 111,211,897 1,540,742 112,752,639 Total revenue Expenses: Salaries and wages Employee benefits Supplies and other Provision for bad debts Depreciation and amortization Interest 43,478,559 7,355,354 50,545,494 16,212,292 5,667,922 5,524,084 128,783,705 (6,978,108) 43,569,179 8,783,541 53,079,657 19,276,426 4,865,055 5,478,734 135,052,592 (22,299,953) Total expenses Loss from operations Gain on sale of assets, net Contribution income Revenue under expenses 18,478 134,746 (6,824,884) 382,764 250,547 (21,666,642) Unrealized gain (loss) on investments, net Equity conversion of notes receivable to affiliates Distributions to parent 13,755 (183,149) (9,500,000) (2,034,500) (33,384,291) 26,552,773 $ (14,653,147) $ (6,831,518) (1,010,500) (7,821,629) (6,831,518) Decrease in net assets Net (deficit) assets, beginning of year Net deficit, end of year See accompanying notes. Year ended September 30 2003 2002 Operating Activities Decrease in net assets $ (33,384,291) * 9,500,000 183,149 2,034,500 (21,666,642) $ (7,821,629) Equity conversion of notes receivable to affiliates Unrealized (gain) loss on investments Distributions to parent Revenue under expenses Adjustments to reconcile revenue under expenses to net cash provided by operating activities: Depreciation and amortization Amortization of original issue discount Amortization of debt issuance costs (13,755) 1,010,500 (6,824,884) 5,667,922 70,407 134,066 16,212,292 (18,478) 4,865,055 70,407 134,067 19,276,426 (382,764) Provision for bad debts Gain on sale of assets, net Effect of changes in operating assets and liabilities: Accounts receivable, net Third-party receivables Inventories and other current assets Accounts payable Accrued interest payable, accrued salaries and employee benefits, and other accrued expenses Professional liability Net cash provided by operating activities (17,394,981) 1,833,699 1,008,011 3,038,194 (10,082,434) 5,046,225 2,647,080 (1,208,224) 634,458 257,489 4,618,195 3,017,087 2,923,150 4,639,433 Investing Activities Acquisitions of property and equipment Proceeds on sale of assets (2,215,287) 2,287,555 1,130,891 (1,584,390) 1,361,583 980,352 (2,129,402) 1,455,598 640,470 (1,822,023) 289,072 (1,566,285) Net decrease in assets limited as to use Loans to affiliates Settlements of loans by affiliates Net cash provided by (used in) investing activities Financing Activities Payments of long-term debt (Decrease) increase in short-term borrowings Distributions to parent Net cash used in financing activities (2,025,769) (2,562,278) (1,010,500) (5,598,547) (1,938,648) 900,000 _(2,034,500) (3,073,148) Net increase (decrease) in cash and cash equivalents Cash and cash equivalents at beginning of year Cash and cash equivalents at end of year 100 100 * 100 100
Step by Step Solution
There are 3 Steps involved in it

Get step-by-step solutions from verified subject matter experts