

Question: what is the Density given the following graph question says from density of shape. i was not sure what data from this table i needed
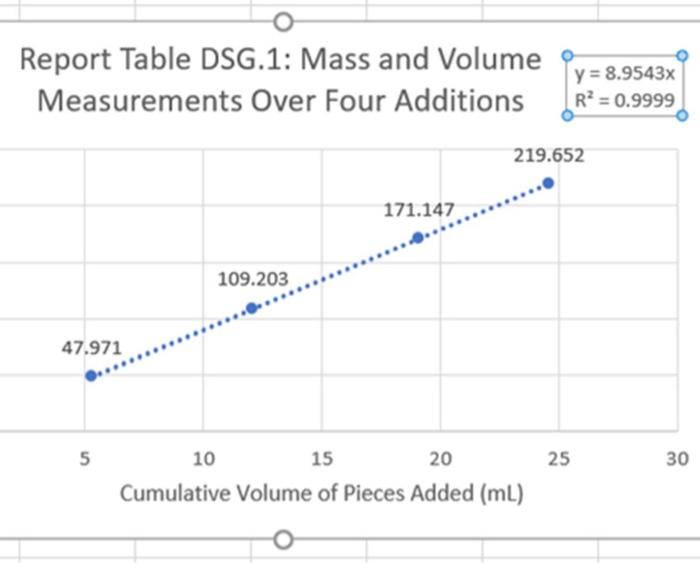
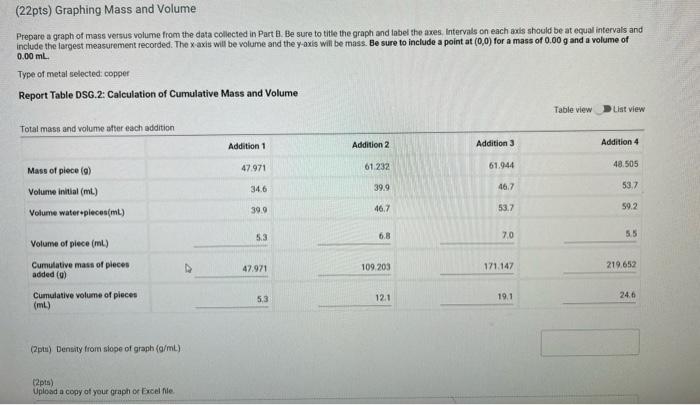
Report Table DSG.1: Mass and Volume Measurements Over Four Additions y = 8.9543x R= 0.9999 219.652 171.147 109.203 47.971 5 25 30 10 15 20 Cumulative Volume of Pieces Added (ml) (22pts) Graphing Mass and Volume Prepare a graph of mass versus volume from the data collected in Part B. Be sure to title the graph and label the axes Intervals on each axis should be at equal intervals and include the largest measurement recorded. The x-axis will be volume and the y-axis will be mass. Be sure to include a point at (0,0) for a mass of 0.00 g and a volume of 0.00 mL Type of metal selected copper Report Table DSG.2: Calculation of Cumulative Mass and Volume Table view List view Total mass and volume after each addition Addition 1 Addition 2 Addition 3 Addition 4 47.971 61.232 61.944 48.505 34.6 39.9 46.7 Mass of piece (0) Volume initial (mt) Volume water-plecen(mt) 53.7 39.9 46.7 53.7 59.2 5.3 6.8 70 55 47.971 109203 171.147 Volume of plece (ml) Cumulative mass of places added (0) Cumulative volume of places (ml) 219.652 53 6.3 121 19.1 24.6 (2ptu) Density from slope of graph (g/mL) 12pts) Upload a copy of your graph of Excelle
Step by Step Solution
There are 3 Steps involved in it

Get step-by-step solutions from verified subject matter experts