

Question: What is the equation using the table below showing the regression of sales and advertising? SUMMARY OUTPUT Regression Statistics Multiple R 0.99085 R Square 0.98177
What is the equation using the table below showing the regression of sales and advertising?
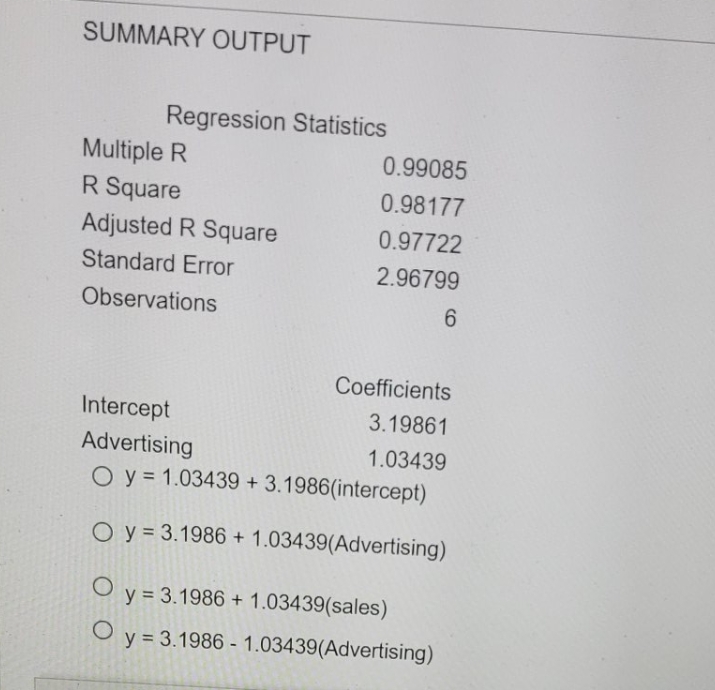
SUMMARY OUTPUT Regression Statistics Multiple R 0.99085 R Square 0.98177 Adjusted R Square 0.97722 Standard Error 2.96799 Observations 6 Coefficients Intercept 3. 19861 Advertising 1.03439 O y = 1.03439 + 3.1986(intercept) O y = 3.1986 + 1.03439(Advertising) O y = 3.1986 + 1.03439(sales) O y = 3.1986 - 1.03439(Advertising)
Step by Step Solution
There are 3 Steps involved in it
1 Expert Approved Answer
Step: 1 Unlock

Question Has Been Solved by an Expert!
Get step-by-step solutions from verified subject matter experts
Step: 2 Unlock
Step: 3 Unlock