

Question: What is the formula to answer the frequency table below? I am confused about the excel steps. Executives at The Walt Disney Company are interested
What is the formula to answer the frequency table below? I am confused about the excel steps.
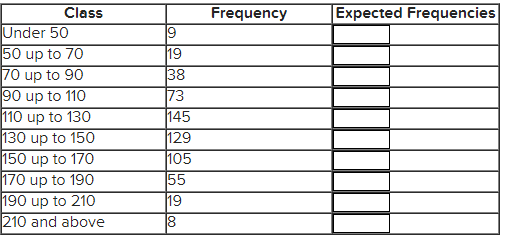
Executives at The Walt Disney Company are interested in estimating the mean spending per capita for people who visit Disney World in Orlando, Florida. They plan to use the Z-distribution but they know it requires that the population be normally distributed. Six hundred customers were randomly surveyed, and the amount spent during their stay at Disney World was recorded. Before using the sample data to estimate the population mean, the managers wish to test at the 0.01significance level to determine whether the population is normally distributed. The data has been organized into the frequency table below.
DATA TO ANSWER QUESTIONS
Class Frequency
Under 50 9
50 up to 70 19
70 up to 90 38
90 up to 110 73
110 up to 130 145
130 up to 150 129
150 up to 170 105
170 up to 190 55
190 up to 210 19
210 and above 8
a.Calculate the expected frequencies if the population is normally distributed. The sample mean is132.3 and the sample standard deviation is32.4.(5points)(Round the expected frequencies to 2 decimal places)
\f
Step by Step Solution
There are 3 Steps involved in it

Get step-by-step solutions from verified subject matter experts