

What is the free cash flow for each year General Assumptions Forecast Scenario Transaction Date Fiscal Year-End
Fantastic news! We've Found the answer you've been seeking!
Question:
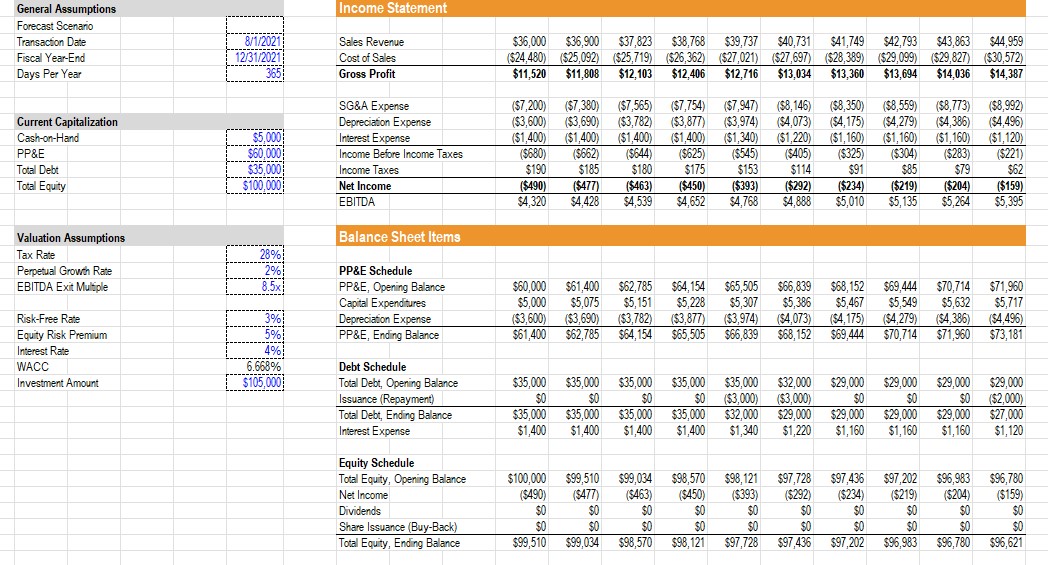
What is the free cash flow for each year
Transcribed Image Text:
General Assumptions Forecast Scenario Transaction Date Fiscal Year-End Days Per Year Current Capitalization Cash-on-Hand PP&E Total Debt Total Equity Valuation Assumptions Tax Rate Perpetual Growth Rate EBITDA Exit Multiple Risk-Free Rate Equity Risk Premium Interest Rate WACC Investment Amount 8/1/2021 12/31/2021 365 LITT $5,000 $60,000 $35,000 $100,000 28% 2% 8.5x 3% 4% 6.668% $105,000 Income Statement Sales Revenue Cost of Sales Gross Profit SG&A Expense Depreciation Expense Interest Expense Income Before Income Taxes Income Taxes Net Income EBITDA Balance Sheet Items PP&E Schedule PP&E, Opening Balance Capital Expenditures Depreciation Expense PP&E, Ending Balance Debt Schedule Total Debt, Opening Balance Issuance (Repayment) Total Debt, Ending Balance Interest Expense Equity Schedule Total Equity, Opening Balance Net Income Dividends Share Issuance (Buy-Back) Total Equity, Ending Balance $36,000 $36,900 $37,823 $38,768 $39,737 $40,731 $41,749 $42,793 $43,863 $44,959 ($24,480) ($25,092) ($25,719) ($26,362) ($27,021) ($27,697) ($28,389) ($29,099) ($29,827) ($30,572) $11,520 $11,808 $12,103 $12,406 $12,716 $13,034 $13,360 $13,694 $14,036 $14,387 ($7,200) ($7,380) ($3,600) ($3,690) ($1,400) ($1,400) ($680) $190 ($662) $185 ($490) ($477) $4,320 $4,428 ($7,565) ($7,754) ($7,947) ($8,146) ($8,350) ($8,559) ($8,773) ($3,782) ($3,877) ($3,974) ($4,073) ($4,175) ($4,279) ($4,386) ($1,400) ($1,400) ($1,340) ($1,220) ($1,160) ($1,160) ($1,160) ($644) ($625) ($545) ($405) $175 $153 $114 ($450) ($393) ($292) $4,652 $4,768 $4,888 $180 ($463) ($325) ($304) ($283) $91 $85 $79 ($234) ($219) ($204) $5,010 $5,135 $5.264 $4,539 PO JUAT $100,000 ($490) $35,000 $35,000 $35,000 $35,000 $0 $0 $0 $0 $35,000 $35,000 $35,000 $35.000 $1,400 $1,400 $1,400 $1,400 $0 $0 $99,510 $68,152 $69,444 $70,714 $71,960 $60,000 $61,400 $62,785 $64,154 $65,505 $66,839 $5,000 $5,075 $5,151 $5,228 $5,307 $5,386 $5,467 $5,549 $5,632 $5,717 ($3,600) ($3,690) ($3,782) ($3,877) ($3,974) ($4,073) ($4,175) ($4,279) ($4,386) ($4,496) $61,400 $62,785 $64,154 $65,505 $66,839 $68,152 $69,444 $70,714 $71,960 $73,181 $0 $0 $98,570 $99,510 $99,034 $98,570 $98,121 ($477) ($463) ($450) ($393) ($292) $0 $0 $0 $0 $0 $0 $99,034 $98,121 $97,728 $97,728 $97,436 $97,202 $96,983 ($234) ($219) ($204) $0 $0 $0 $0 $0 $0 $96.983 $96,780 $35,000 $32,000 $29,000 $29,000 $29,000 $29,000 ($3,000) ($3,000) $0 $0 $0 ($2,000) $32,000 $29,000 $29,000 $29,000 $29,000 $27,000 $1,340 $1,220 $1,160 $1,160 $1,160 $1,120 ($8,992) ($4,496) ($1,120) ($221) $62 $0 $0 $97,436 ($159) $5,395 $97,202 $97,202 $96,780 ($159) $0 $0 $96,621 General Assumptions Forecast Scenario Transaction Date Fiscal Year-End Days Per Year Current Capitalization Cash-on-Hand PP&E Total Debt Total Equity Valuation Assumptions Tax Rate Perpetual Growth Rate EBITDA Exit Multiple Risk-Free Rate Equity Risk Premium Interest Rate WACC Investment Amount 8/1/2021 12/31/2021 365 LITT $5,000 $60,000 $35,000 $100,000 28% 2% 8.5x 3% 4% 6.668% $105,000 Income Statement Sales Revenue Cost of Sales Gross Profit SG&A Expense Depreciation Expense Interest Expense Income Before Income Taxes Income Taxes Net Income EBITDA Balance Sheet Items PP&E Schedule PP&E, Opening Balance Capital Expenditures Depreciation Expense PP&E, Ending Balance Debt Schedule Total Debt, Opening Balance Issuance (Repayment) Total Debt, Ending Balance Interest Expense Equity Schedule Total Equity, Opening Balance Net Income Dividends Share Issuance (Buy-Back) Total Equity, Ending Balance $36,000 $36,900 $37,823 $38,768 $39,737 $40,731 $41,749 $42,793 $43,863 $44,959 ($24,480) ($25,092) ($25,719) ($26,362) ($27,021) ($27,697) ($28,389) ($29,099) ($29,827) ($30,572) $11,520 $11,808 $12,103 $12,406 $12,716 $13,034 $13,360 $13,694 $14,036 $14,387 ($7,200) ($7,380) ($3,600) ($3,690) ($1,400) ($1,400) ($680) $190 ($662) $185 ($490) ($477) $4,320 $4,428 ($7,565) ($7,754) ($7,947) ($8,146) ($8,350) ($8,559) ($8,773) ($3,782) ($3,877) ($3,974) ($4,073) ($4,175) ($4,279) ($4,386) ($1,400) ($1,400) ($1,340) ($1,220) ($1,160) ($1,160) ($1,160) ($644) ($625) ($545) ($405) $175 $153 $114 ($450) ($393) ($292) $4,652 $4,768 $4,888 $180 ($463) ($325) ($304) ($283) $91 $85 $79 ($234) ($219) ($204) $5,010 $5,135 $5.264 $4,539 PO JUAT $100,000 ($490) $35,000 $35,000 $35,000 $35,000 $0 $0 $0 $0 $35,000 $35,000 $35,000 $35.000 $1,400 $1,400 $1,400 $1,400 $0 $0 $99,510 $68,152 $69,444 $70,714 $71,960 $60,000 $61,400 $62,785 $64,154 $65,505 $66,839 $5,000 $5,075 $5,151 $5,228 $5,307 $5,386 $5,467 $5,549 $5,632 $5,717 ($3,600) ($3,690) ($3,782) ($3,877) ($3,974) ($4,073) ($4,175) ($4,279) ($4,386) ($4,496) $61,400 $62,785 $64,154 $65,505 $66,839 $68,152 $69,444 $70,714 $71,960 $73,181 $0 $0 $98,570 $99,510 $99,034 $98,570 $98,121 ($477) ($463) ($450) ($393) ($292) $0 $0 $0 $0 $0 $0 $99,034 $98,121 $97,728 $97,728 $97,436 $97,202 $96,983 ($234) ($219) ($204) $0 $0 $0 $0 $0 $0 $96.983 $96,780 $35,000 $32,000 $29,000 $29,000 $29,000 $29,000 ($3,000) ($3,000) $0 $0 $0 ($2,000) $32,000 $29,000 $29,000 $29,000 $29,000 $27,000 $1,340 $1,220 $1,160 $1,160 $1,160 $1,120 ($8,992) ($4,496) ($1,120) ($221) $62 $0 $0 $97,436 ($159) $5,395 $97,202 $97,202 $96,780 ($159) $0 $0 $96,621 General Assumptions Forecast Scenario Transaction Date Fiscal Year-End Days Per Year Current Capitalization Cash-on-Hand PP&E Total Debt Total Equity Valuation Assumptions Tax Rate Perpetual Growth Rate EBITDA Exit Multiple Risk-Free Rate Equity Risk Premium Interest Rate WACC Investment Amount 8/1/2021 12/31/2021 365 LITT $5,000 $60,000 $35,000 $100,000 28% 2% 8.5x 3% 4% 6.668% $105,000 Income Statement Sales Revenue Cost of Sales Gross Profit SG&A Expense Depreciation Expense Interest Expense Income Before Income Taxes Income Taxes Net Income EBITDA Balance Sheet Items PP&E Schedule PP&E, Opening Balance Capital Expenditures Depreciation Expense PP&E, Ending Balance Debt Schedule Total Debt, Opening Balance Issuance (Repayment) Total Debt, Ending Balance Interest Expense Equity Schedule Total Equity, Opening Balance Net Income Dividends Share Issuance (Buy-Back) Total Equity, Ending Balance $36,000 $36,900 $37,823 $38,768 $39,737 $40,731 $41,749 $42,793 $43,863 $44,959 ($24,480) ($25,092) ($25,719) ($26,362) ($27,021) ($27,697) ($28,389) ($29,099) ($29,827) ($30,572) $11,520 $11,808 $12,103 $12,406 $12,716 $13,034 $13,360 $13,694 $14,036 $14,387 ($7,200) ($7,380) ($3,600) ($3,690) ($1,400) ($1,400) ($680) $190 ($662) $185 ($490) ($477) $4,320 $4,428 ($7,565) ($7,754) ($7,947) ($8,146) ($8,350) ($8,559) ($8,773) ($3,782) ($3,877) ($3,974) ($4,073) ($4,175) ($4,279) ($4,386) ($1,400) ($1,400) ($1,340) ($1,220) ($1,160) ($1,160) ($1,160) ($644) ($625) ($545) ($405) $175 $153 $114 ($450) ($393) ($292) $4,652 $4,768 $4,888 $180 ($463) ($325) ($304) ($283) $91 $85 $79 ($234) ($219) ($204) $5,010 $5,135 $5.264 $4,539 PO JUAT $100,000 ($490) $35,000 $35,000 $35,000 $35,000 $0 $0 $0 $0 $35,000 $35,000 $35,000 $35.000 $1,400 $1,400 $1,400 $1,400 $0 $0 $99,510 $68,152 $69,444 $70,714 $71,960 $60,000 $61,400 $62,785 $64,154 $65,505 $66,839 $5,000 $5,075 $5,151 $5,228 $5,307 $5,386 $5,467 $5,549 $5,632 $5,717 ($3,600) ($3,690) ($3,782) ($3,877) ($3,974) ($4,073) ($4,175) ($4,279) ($4,386) ($4,496) $61,400 $62,785 $64,154 $65,505 $66,839 $68,152 $69,444 $70,714 $71,960 $73,181 $0 $0 $98,570 $99,510 $99,034 $98,570 $98,121 ($477) ($463) ($450) ($393) ($292) $0 $0 $0 $0 $0 $0 $99,034 $98,121 $97,728 $97,728 $97,436 $97,202 $96,983 ($234) ($219) ($204) $0 $0 $0 $0 $0 $0 $96.983 $96,780 $35,000 $32,000 $29,000 $29,000 $29,000 $29,000 ($3,000) ($3,000) $0 $0 $0 ($2,000) $32,000 $29,000 $29,000 $29,000 $29,000 $27,000 $1,340 $1,220 $1,160 $1,160 $1,160 $1,120 ($8,992) ($4,496) ($1,120) ($221) $62 $0 $0 $97,436 ($159) $5,395 $97,202 $97,202 $96,780 ($159) $0 $0 $96,621
Expert Answer:
Answer rating: 100% (QA)
Year Free Cash Flow 2021 490 2022 477 2023 463 2024 450 2025 393 2026 292 20... View the full answer

Related Book For 
Financial Reporting and Analysis
ISBN: 978-1259722653
7th edition
Authors: Lawrence Revsine, Daniel Collins, Bruce Johnson, Fred Mittelstaedt, Leonard Soffer
Posted Date:
Students also viewed these finance questions
-
1a. Here are the financial statements for two companies; All data is in $ and correct units except where specified(*). Company 1 Company 2 XYZ Income Statement ABC Income Statement Sales Revenue 344,...
-
3 4 5 6 7 8 9 10 11 12 13 14 15 16 17 18 Mo's Motor Corp. issued $ 380,000 of 7%, 5-year bonds on April 1, 2021. Interest is payable semi-annually on April 1 and October 1. On April 1, 2023,...
-
The following additional information is available for the Dr. Ivan and Irene Incisor family from Chapters 1-5. Ivan's grandfather died and left a portfolio of municipal bonds. In 2012, they pay Ivan...
-
4. In cells B4:B15, type a yearly salary for each staff member. Format these values as Currency with no decimal places. 5. Calculate the new salary with a 10% increase in column C. 6. Calculate the...
-
A battery is connected to a clock by copper wires as shown. What is the direction of current through the clock (B to C or C to B)? What is the direction of current through the battery (D to A or A to...
-
a summary of Case 1 (MGM Resorts International: Responsibility vs. Profitability)
-
It has been argued that to be classified as a professional one must offer services to the public rather than simply be an employee of an organization. As such, most employees of an organization,...
-
Bill Alexander and his wife Valerie are both employed. Bill will have an adjusted gross income this year of $70,000. Valerie has an adjusted gross income of $2000 a month. Bill and Valerie have...
-
In Question 12.3, assume that the property is currently owned by McDonald's. a. What is McDonald's expected NPV from selling the property, evaluated from an MV perspective? b. What is McDonald's...
-
Denise Lopez, age 40, is single and has no dependents. She is employed as a legal secretary by Legal Services, Inc. She owns and operates Typing Services located near the campus of Florida Atlantic...
-
You are a Project Engineer on a large earth dam project that has a volume of 5x10⁶ yd of select fill, compacted such that the final voids ratio in the dam is 0.80. Your boss, the Project Manager...
-
You are trying a new restaurant that offers a sampler where you get to choose five appetizers from a list of 12. How many ways can you choose a sampler? It can feel like many flights arrive late when...
-
In the following Data Flow Diagram there are multiple errors. Highlight and number five of the errors, then define the type of error below. (5 marks)+ A H J K L 1.0: D 3.0: C M 2.0: E 4.0: F R P N G...
-
Eitan purchased an office building in April of 2015 for $165,000. If he sold the building in June of 2022, how much depreciation will he deduct for this building in 2022?
-
Stephen runs a pet salon. He is currently grooming 115 dogs per week. If instead of grooming 115 dogs, he grooms 116 dogs, he will add $65.93 to his costs and $69.68 to his revenues. What will be the...
-
Steve is married filing jointly with his wife Nancy and operates a business as a sole proprietor. His business is a small tax and accounting business where he has two employees who are paid a total...
-
Annuity Project: Where will you spend your last chapter of your life? This is an INDIVIDUAL PROJECT. Very similar work will get ZERO. Submit your answer in MS WORD. Where will you spend the last part...
-
Complete problem P10-21 using ASPE. Data from P10-21 Original cost ................................................................. $7,000,000 Accumulated depreciation...
-
In mid-2000, Enron Corporation and Blockbuster (a division of Viacom) set up a pilot project, streaming videos to a few dozen apartments in Portland, Oregon, from servers set up in the basement of...
-
On December 31, 2017, Toms River Rafting, Inc. (TRR), has a deferred tax asset related to a $250,000 net operating loss carryforward. The enacted tax rate (and substantively enacted tax rate) at the...
-
Karr, Inc., reported net income of $300,000 for 2017. Changes occurred in several balance sheet accounts as follows: Additional Information: a. During 2017, Karr sold equipment costing $25,000, with...
-
Argue, using the adjacency matrix only, that the graph in Figure 1.6 (a) is not connected.
-
There is a function in the KnoxOR`Graphs` package called This command returns a list of all children of vertices in the given list of parents, where adjmatrix is the adjacency matrix of a directed...
-
Decide whether the following graph is (a) connected or (b) quasi-connected. ex12 = {{0, 1, 1, 0, 0}, {0, 0, 1, 1, 0}, {1, 0, 0, 0, 0}, (0, 0, 0, 0, 1}, {0, 1, 1, 1, 0}}; DisplayGraph[ex12, GraphType...

Study smarter with the SolutionInn App