Question: What is the individual, variable, and type of variable (qualitative, quantitative, quantitative-discrete, quantitative-continuous)? Section 2.1: Homework 1.) Eyeglassomatic manufactures eyeglasses for different retailers. The number
What is the individual, variable, and type of variable (qualitative, quantitative, quantitative-discrete, quantitative-continuous)?
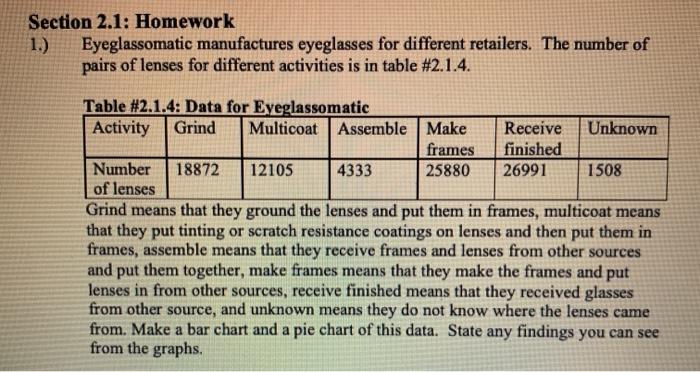
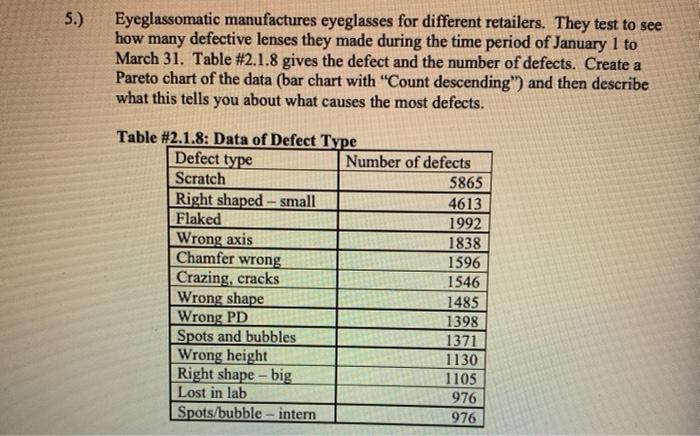
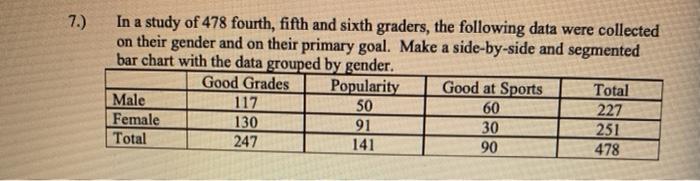
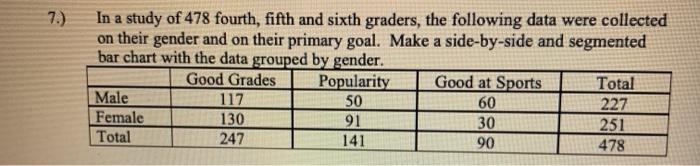
Section 2.1: Homework 1.) Eyeglassomatic manufactures eyeglasses for different retailers. The number of pairs of lenses for different activities is in table #2.1.4. Table #2.1.4: Data for Eyeglassomatic Activity Grind Multicoat Assemble Make Receive Unknown frames finished Number 18872 12105 4333 25880 26991 1508 of lenses Grind means that they ground the lenses and put them in frames, multicoat means that they put tinting or scratch resistance coatings on lenses and then put them in frames, assemble means that they receive frames and lenses from other sources and put them together, make frames means that they make the frames and put lenses in from other sources, receive finished means that they received glasses from other source, and unknown means they do not know where the lenses came from. Make a bar chart and a pie chart of this data. State any findings you can see from the graphs. 5.) Eyeglassomatic manufactures eyeglasses for different retailers. They test to see how many defective lenses they made during the time period of January 1 to March 31. Table #2.1.8 gives the defect and the number of defects. Create a Pareto chart of the data (bar chart with "Count descending") and then describe what this tells you about what causes the most defects. Chamfer wrong Table #2.1.8: Data of Defect Type Defect type Number of defects Scratch 5865 Right shaped - small 4613 Flaked 1992 Wrong axis 1838 1596 Crazing, cracks 1546 Wrong shape 1485 Wrong PD 1398 Spots and bubbles 1371 Wrong height 1130 Right shape -- big 1105 Lost in lab 976 Spots/bubble - intern 976 7.) In a study of 478 fourth, fifth and sixth graders, the following data were collected on their gender and on their primary goal. Make a side-by-side and segmented bar chart with the data grouped by gender. Good Grades Popularity Good at Sports Total Male 117 50 60 227 Female 130 91 30 251 Total 247 141 90 478 In a study of 478 fourth, fifth and sixth graders, the following data were collected on their gender and on their primary goal. Make a side-by-side and segmented bar chart with the data grouped by gender. Good Grades Popularity Good at Sports Total Male 117 50 60 227 Female 130 91 30 Total 247 141 90 478 251