

Question: What is the major difference between a simple linear regression model and a multiple linear regression model? Group of answer choices In simple linear regression
What is the major difference between a simple linear regression model and a multiple linear regression model?
Group of answer choices
In simple linear regression you can only have quantitative explanatory variables. In multiple linear regression you can have quantitative and categorical explanatory variables.
In simple linear regression you have many explanatory variables. In multiple linear regression you have only one explanatory variable.
In simple linear regression you have only one explanatory variable. In multiple linear regression you can have many explanatory variables.
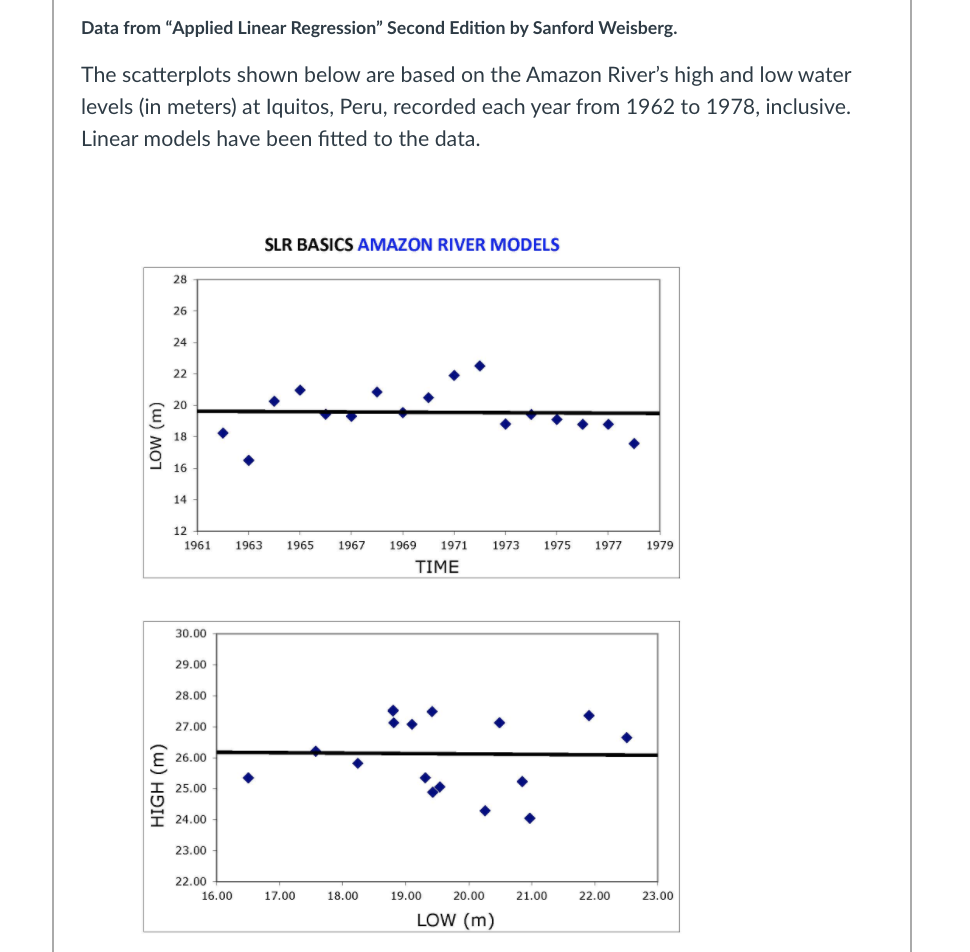

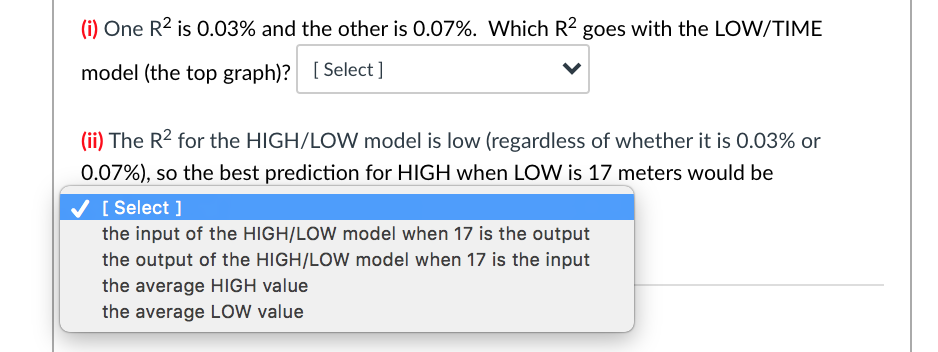
Data from "Applied Linear Regression" Second Edition by Sanford Weisberg. The scatterplots shown below are based on the Amazon River's high and low water levels (in meters) at Iquitos, Peru, recorded each year from 1962 to 1978, inclusive. Linear models have been fitted to the data. SLR BASICS AMAZON RIVER MODELS 28 26 24 22 20 LOW (m) 18 16 14 12 1961 1963 1965 1967 1969 1971 1973 1975 1977 1979 TIME 30.0 29.00 28.00 27.00 26.00 IGH (m) 25.00 24.00 23.00 22.00 16.00 17.00 18.00 19.00 20.00 21.00 22.00 23.00 LOW (m)Question 4 O I 1 pts Which one of the following is not one of the components of an AIS used by companies to achieve their goals? People Internal controls and security measures I- Procedures and instructions internal and external reports data Question 5 0 f 1 pts Which one of the following statements about managerial reports and documents is false? They can be used for external decision making by investors I- They can be used for Internal decision making for control They can support the day to day business operations They can be used for Internal decision making for planning (i) One R2 is 0.03% and the other is 0.07%. Which R2 goes with the LOW/TIME model (the top graph)? [ Select ] (ii) The R2 for the HIGH/LOW model is low (regardless of whether it is 0.03% or 0.07%), so the best prediction for HIGH when LOW is 17 meters would be [ Select ] the input of the HIGH/LOW model when 17 is the output the output of the HIGH/LOW model when 17 is the input the average HIGH value the average LOW value
Step by Step Solution
There are 3 Steps involved in it

Get step-by-step solutions from verified subject matter experts