

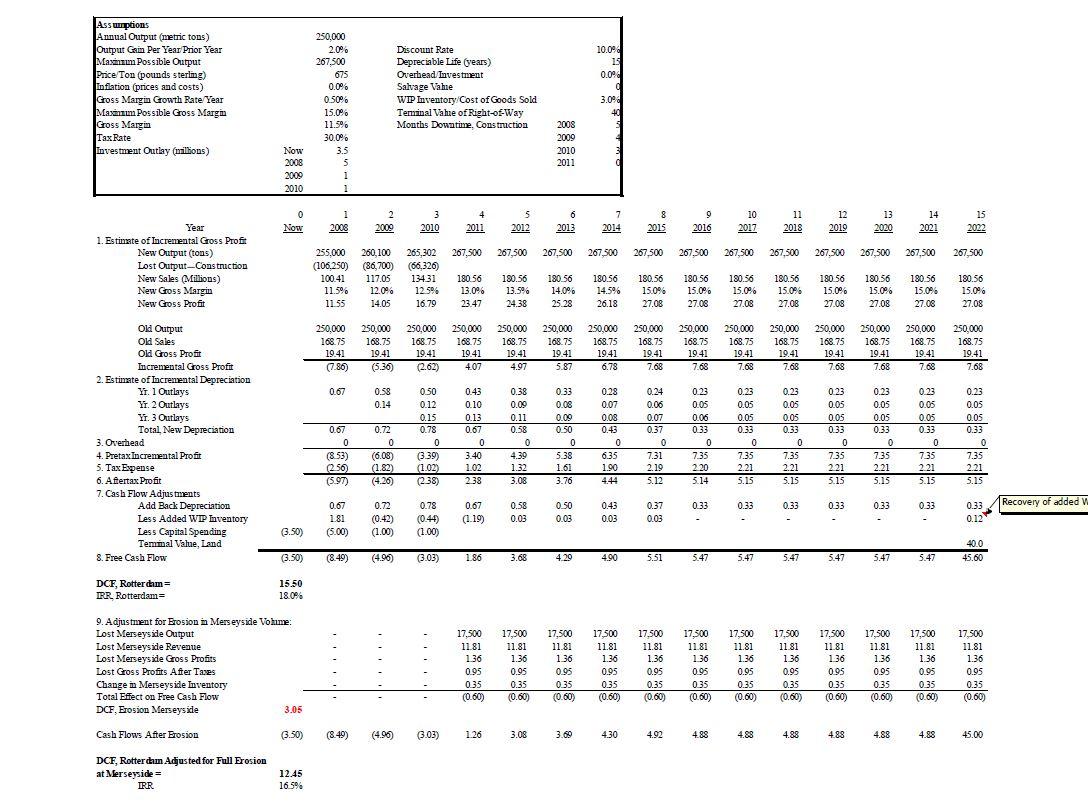
What is the NPV, IRR, Payback Period and growth in EPS? Assumptions Annual Output (metric tons) 250,000
Fantastic news! We've Found the answer you've been seeking!
Question:
What is the NPV, IRR, Payback Period and growth in EPS?
Transcribed Image Text:
Assumptions Annual Output (metric tons) 250,000 Output Gain Per Year Prior Year 2.0% Discount Rate Maximum Possible Output 267,500 Price/Ton (pounds sterling) 675 Tax Rate Inflation (prices and costs) Gross Margin Growth Rate/Year Maximum Possible Gross Margin Gross Margin Investment Outlay (millions) 0.0% Depreciable Life (years) Overhead Investment Salvage Vale 0.50% WIP Inventory/Cost of Goods Sold 15.0% 11.5% Terminal Value of Right-of-Way Months Downtime, Construction 2008 30.0% 2009 Now 3.5 2010 2008 5 2011 2009 1 2010 1 10.0% 15 0.0% 0 3.0% 40 0 1 2 3 Year Now 2008 2009 2010 1. Estimate of Incremental Gross Profit New Output (tons) New Sales (Millions) New Gross Margin New Gross Profit Old Output 255,000 260,100 265,302 267,500 Lost Output Construction (106,250) (86,700) (66,326) 100.41 117.05 134.31 11.5% 11.55 12.0% 12.5% 14.05 16.79 250,000 250,000 250,000 250,000 Old Sales 168.75 168.75 Old Gross Profit 19.41 19.41 168.75 19.41 Incremental Gross Profit (7.86) (5.36) (2.62) 2. Estimate of Incremental Depreciation Yr. 1 Outlays 0.67 0.58 0.50 Yr. 2 Outlays 0.14 0.12 Yr. 3 Outlays 0.15 Total, New Depreciation 0.67 0.72 0.78 3. Overhead 0 0 0 4. Pretax Incremental Profit (8.53) (6.08) (3.39) 5. Tax Expense (256) (1.82) (1.02) 6. Aftertax Profit (5.97) (4.26) (238) 7. Cash Flow Adjustments Add Back Depreciation 0.67 0.72 0.78 Less Added WIP Inventory 1.81 (0.42) (0.44) ''ཟླ ིི ཙྪཱཙྪནྟི ཧྰུྃཊྛུཎྜ, ཨྰཿ ཏཱ ཙིཏྟི 6 2011 2012 2013 7 2014 8 9 10 11 12 13 14 15 2015 2016 2017 2018 2019 2020 2021 2022 267,500 267,500 267,500 267,500 267,500 267,500 267,500 267,500 267,500 267,500 267,500 180.56 180.56 180.56 180.56 180.56 180.56 180.56 180.56 180.56 180.56 180.56 180.56 13.0% 13.5% 14.0% 23.47 24.38 25.28 14.5% 26.18 15.0% 27.08 15.0% 27.08 15.0% 27.08 15.0% 27.08 15.0% 15.0% 15.0% 15.0% 27.08 27.08 27.08 27.08 250,000 250,000 168.75 250,000 168.75 168.75 168.75 250,000 250,000 250,000 250,000 250,000 250,000 168.75 168.75 168.75 168.75 168.75 168.75 250,000 250,000 168.75 168.75 19.41 19.41 19.41 19.41 19.41 19.41 19.41 19.41 19.41 19.41 19.41 19.41 4.07 4.97 5.87 6.78 7.68 7.68 7.68 7.68 7.68 7.68 7.68 7.68 0.43 0.38 0.33 0.28 0.24 0.23 0.23 0.23 0.23 0.23 0.23 0.23 0.10 0.09 0.08 0.07 0.06 0.05 0.05 0.05 0.05 0.05 0.05 0.05 0.13 0.11 0.09 0.08 0.07 0.06 0.05 0.05 0.05 0.05 0.05 0.05 0.67 0.58 0.50 0.43 0.37 0.33 0.33 0.33 0.33 0.33 0.33 0.33 0 0 0 0 0 0 0 0 0 0 0 0 3.40 4.39 5.38 6.35 7.31 7.35 7.35 7.35 7.35 7.35 7.35 7.35 1.02 1.32 1.61 1.90 2.19 2.20 2.21 2.21 221 2.21 2.21 2.21 3.08 3.76 444 5.12 5.14 5.15 5.15 5.15 5.15 5.15 5.15 0.67 0.58 0.50 0.43 0.37 0.33 0.33 0.33 0.33 0.33 0.33 0.33 Recovery of added W (1.19) 0.03 0.03 0.03 0.03 0.12 Less Capital Spending (3.50) (5.00) (1.00) (1.00) 40.0 Temmal Value, Land 8. Free Cash Flow (3.50) (8.49) (4.96) (3.03) 1.86 3.68 4.29 4.90 5.51 5.47 5.47 5:47 5.47 5.47 5.47 45.60 DCF, Rotterdam= 15.50 IRR, Rotterdam= 18.0% 9. Adjustment for Erosion in Merseyside Volume: 17,500 17,500 17,500 17,500 17,500 17,500 17,500 17,500 17,500 17,500 17,500 17,500 11.81 11.81 11.81 11.81 11.81 11.81 11.81 11.81 11.81 11.81 11.81 11.81 136 1.36 1.36 1.36 1.36 136 1.36 136 136 1.36 1.36 1.36 0.95 0.95 0.95 0.95 0.95 0.95 0.95 0.95 0.95 0.95 0.95 0.95 0.35 0.35 0.35 0.35 0.35 0.35 0.35 0.35 0.35 0.35 0.35 0.35 (0.60) (0.60) (0.60) (0.60) (0.60) (0.60) (0.60) (0.60) (0.60) (0.60) (0.60) (0.60) Lost Merseyside Output Lost Merseyside Revenue Lost Merseyside Gross Profits Lost Gross Profits After Taxes Change in Merseyside Inventory Total Effect on Free Cash Flow DCF, Erosion Merseyside 3.05 Cash Flows After Erosion (3.50) (8.49) (4.96) (3.03) 26 1.26 3.08 8 DCF, Rotterdam Adjusted for Full Erosion at Merseyside = 12.45 IRR 16.5% 3.69 4.30 4.92 4.88 4.88 4.88 4.88 4.88 4.88 45.00 Assumptions Annual Output (metric tons) 250,000 Output Gain Per Year Prior Year 2.0% Discount Rate Maximum Possible Output 267,500 Price/Ton (pounds sterling) 675 Tax Rate Inflation (prices and costs) Gross Margin Growth Rate/Year Maximum Possible Gross Margin Gross Margin Investment Outlay (millions) 0.0% Depreciable Life (years) Overhead Investment Salvage Vale 0.50% WIP Inventory/Cost of Goods Sold 15.0% 11.5% Terminal Value of Right-of-Way Months Downtime, Construction 2008 30.0% 2009 Now 3.5 2010 2008 5 2011 2009 1 2010 1 10.0% 15 0.0% 0 3.0% 40 0 1 2 3 Year Now 2008 2009 2010 1. Estimate of Incremental Gross Profit New Output (tons) New Sales (Millions) New Gross Margin New Gross Profit Old Output 255,000 260,100 265,302 267,500 Lost Output Construction (106,250) (86,700) (66,326) 100.41 117.05 134.31 11.5% 11.55 12.0% 12.5% 14.05 16.79 250,000 250,000 250,000 250,000 Old Sales 168.75 168.75 Old Gross Profit 19.41 19.41 168.75 19.41 Incremental Gross Profit (7.86) (5.36) (2.62) 2. Estimate of Incremental Depreciation Yr. 1 Outlays 0.67 0.58 0.50 Yr. 2 Outlays 0.14 0.12 Yr. 3 Outlays 0.15 Total, New Depreciation 0.67 0.72 0.78 3. Overhead 0 0 0 4. Pretax Incremental Profit (8.53) (6.08) (3.39) 5. Tax Expense (256) (1.82) (1.02) 6. Aftertax Profit (5.97) (4.26) (238) 7. Cash Flow Adjustments Add Back Depreciation 0.67 0.72 0.78 Less Added WIP Inventory 1.81 (0.42) (0.44) ''ཟླ ིི ཙྪཱཙྪནྟི ཧྰུྃཊྛུཎྜ, ཨྰཿ ཏཱ ཙིཏྟི 6 2011 2012 2013 7 2014 8 9 10 11 12 13 14 15 2015 2016 2017 2018 2019 2020 2021 2022 267,500 267,500 267,500 267,500 267,500 267,500 267,500 267,500 267,500 267,500 267,500 180.56 180.56 180.56 180.56 180.56 180.56 180.56 180.56 180.56 180.56 180.56 180.56 13.0% 13.5% 14.0% 23.47 24.38 25.28 14.5% 26.18 15.0% 27.08 15.0% 27.08 15.0% 27.08 15.0% 27.08 15.0% 15.0% 15.0% 15.0% 27.08 27.08 27.08 27.08 250,000 250,000 168.75 250,000 168.75 168.75 168.75 250,000 250,000 250,000 250,000 250,000 250,000 168.75 168.75 168.75 168.75 168.75 168.75 250,000 250,000 168.75 168.75 19.41 19.41 19.41 19.41 19.41 19.41 19.41 19.41 19.41 19.41 19.41 19.41 4.07 4.97 5.87 6.78 7.68 7.68 7.68 7.68 7.68 7.68 7.68 7.68 0.43 0.38 0.33 0.28 0.24 0.23 0.23 0.23 0.23 0.23 0.23 0.23 0.10 0.09 0.08 0.07 0.06 0.05 0.05 0.05 0.05 0.05 0.05 0.05 0.13 0.11 0.09 0.08 0.07 0.06 0.05 0.05 0.05 0.05 0.05 0.05 0.67 0.58 0.50 0.43 0.37 0.33 0.33 0.33 0.33 0.33 0.33 0.33 0 0 0 0 0 0 0 0 0 0 0 0 3.40 4.39 5.38 6.35 7.31 7.35 7.35 7.35 7.35 7.35 7.35 7.35 1.02 1.32 1.61 1.90 2.19 2.20 2.21 2.21 221 2.21 2.21 2.21 3.08 3.76 444 5.12 5.14 5.15 5.15 5.15 5.15 5.15 5.15 0.67 0.58 0.50 0.43 0.37 0.33 0.33 0.33 0.33 0.33 0.33 0.33 Recovery of added W (1.19) 0.03 0.03 0.03 0.03 0.12 Less Capital Spending (3.50) (5.00) (1.00) (1.00) 40.0 Temmal Value, Land 8. Free Cash Flow (3.50) (8.49) (4.96) (3.03) 1.86 3.68 4.29 4.90 5.51 5.47 5.47 5:47 5.47 5.47 5.47 45.60 DCF, Rotterdam= 15.50 IRR, Rotterdam= 18.0% 9. Adjustment for Erosion in Merseyside Volume: 17,500 17,500 17,500 17,500 17,500 17,500 17,500 17,500 17,500 17,500 17,500 17,500 11.81 11.81 11.81 11.81 11.81 11.81 11.81 11.81 11.81 11.81 11.81 11.81 136 1.36 1.36 1.36 1.36 136 1.36 136 136 1.36 1.36 1.36 0.95 0.95 0.95 0.95 0.95 0.95 0.95 0.95 0.95 0.95 0.95 0.95 0.35 0.35 0.35 0.35 0.35 0.35 0.35 0.35 0.35 0.35 0.35 0.35 (0.60) (0.60) (0.60) (0.60) (0.60) (0.60) (0.60) (0.60) (0.60) (0.60) (0.60) (0.60) Lost Merseyside Output Lost Merseyside Revenue Lost Merseyside Gross Profits Lost Gross Profits After Taxes Change in Merseyside Inventory Total Effect on Free Cash Flow DCF, Erosion Merseyside 3.05 Cash Flows After Erosion (3.50) (8.49) (4.96) (3.03) 26 1.26 3.08 8 DCF, Rotterdam Adjusted for Full Erosion at Merseyside = 12.45 IRR 16.5% 3.69 4.30 4.92 4.88 4.88 4.88 4.88 4.88 4.88 45.00
Expert Answer:
Answer rating: 100% (QA)
To calculate the NPV IRR Payback Period and growth in EPS we will use the provided financial data an... View the full answer

Related Book For 
Posted Date:
Students also viewed these finance questions
-
In problem 11, a researcher asked college students to evaluate three new cell phone designs. However, the researcher suspects that college students may have criteria that are different from those...
-
17. [1.1/2 Points] DETAILS PREVIOUS ANSWERS MY NOTES ASK YOUR TEACHER Write the composite function in the form f(g(x)). [Identify the inner function u-g(x) and the outer function y=f(u).) (Use...
-
Abbee Aviation (AV) has 40 million shares of stock outstanding, that trade at $40. The risk-free interest rate is 2% and the market risk premium is 8.9%. This stock has a beta of 2.7. AV also has...
-
Parmco, a calendar year corporation, made the following accruals for 2016 financial statement purposes. In each case, determine how much of the accrued expense is deductible on Parmcos 2016 federal...
-
This appeal involves the validity of a will executed in contravention of an earlier contract to make mutual wills. A husband and wife signed a contract to make mutual wills and then executed those...
-
Speedy Oil provides a single-channel automobile oil change and lubrication service. Customers provide an arrival rate of 2.5 cars per hour. The service rate is 5 cars per hour. Assume that arrivals...
-
Draw a diagram with the wage-setting relation and price-setting relation. Label your wage-setting curve WS and your price setting line PS. Label the y axis the Real Wage and the x axis the...
-
GRANT MANAGEMENT CONSULTANTS Comparative Balance Sheets January 1 and December 31, 2014 Jan. 1 Dec. 31 20,000 55,000 40,000 37,000 60,000 92,000 30,000 32,000 20,000 20,000 10,000 40,000 60,000...
-
What is human resource development?
-
What are the ethical implications and societal challenges associated with the use of genetic information, including genetic testing, personalized medicine, and genomic data privacy, and how can these...
-
The next dividend payment by Dizzle, Inc., will be $2.85 per share. The dividends are anticipated to maintain a growth rate of 5.00 percent, forever If the stock currently sells for $49.30 per share,...
-
On September 21, one year before maturity, Duller Image, Inc., retired $1,200,000 of its 5% gross bonds payable at the current market price of 98% of the face amount (or 0.98 $1,200,000 =...
-
The force shown has magnitude Fp = 20 N and makes an angle of 30 to the ground. Calculate the work done by this force, using the dot product, when the wagon is dragged 100 m along the ground. L. 8 a
-
Aloha Inc. has 4.1 percent coupon bonds on the market that have 9 years left to maturity. If the YTM on these bonds is 7.5 percent, what is the current bond price? The bond pays coupons twice a year....
-
In case you are appointed the task of examining a significant arrangement of your organization, what are the essential 3 stages you will take? How could it be that you'll at last choose the...
-
The baseball player A hits the ball from a height of 3.36 ft with an initial velocity of 34.8 ft/s. 0.14 seconds after the ball is hit, player B who is standing 15 ft away from home plate begins to...
-
In early July 2019, the U.S. Treasury issued three T-Bills, and they had issued a one-year T-Bill on June 20, 2019: a. Calculate the bank discount rate for each security using the formula given in...
-
Using the same workbook, copy both datasets into one worksheet so that they can be used together in a pivot table. Transpose them using Paste Special Transpose. Data from Alphabet Financials.xlsx...
-
Use the same data as in Problem 1. a. Recalculate the percentage of sales income statement, but this time use the Trend function to forecast other income and interest expense. b. Recalculate the...
-
If a person has a highly elastic demand, will he likely bear a large or small percentage of the burden of a tax?
-
Minneapolis Federal Reserve Bank economist Edward Prescott estimates the elasticity of the U.S. labor supply to be 3. Given this elasticity, what would be the impact of funding the Social Security...
-
How much of a $100 tax would a consumer pay if elasticity of demand is 0.2 and elasticity of supply is 1.8?

Study smarter with the SolutionInn App