Question: What is the NPV (Net Present Value) for HP Inc. https://finance.yahoo.com/quote/HPQ/key-statistics?ltr=1 EXHIBIT 1: REVENUE TREND FOR PUBLICLY LISTED 3D COMPANIES (IN US$ MILLIONS) Rank Company
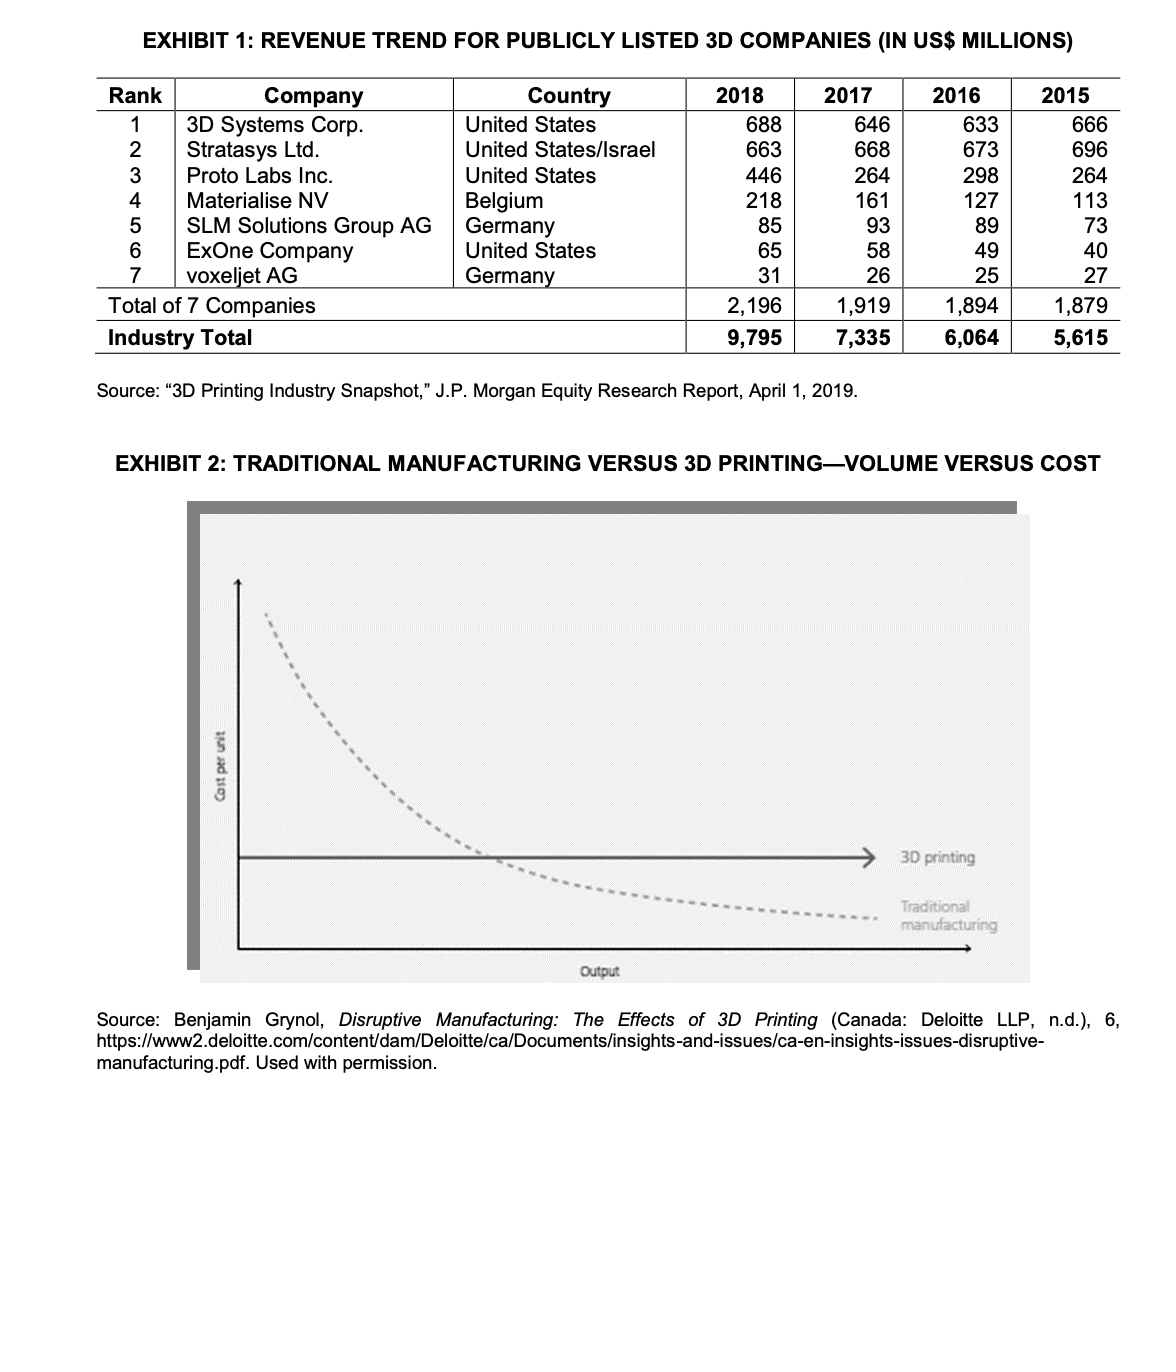
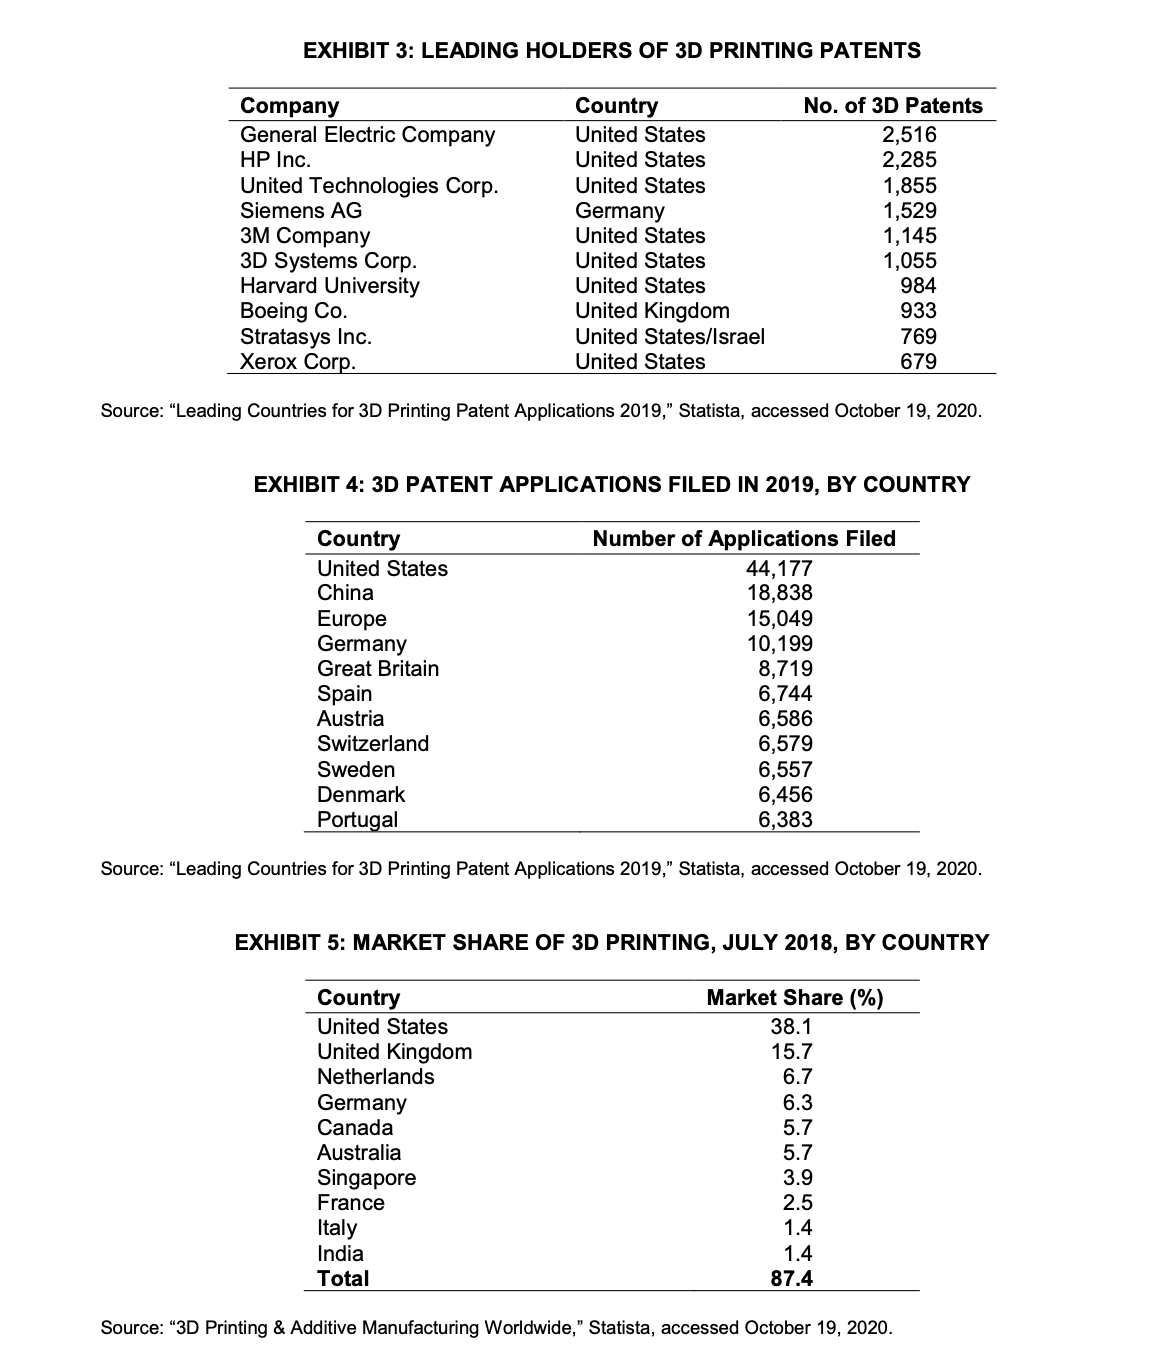
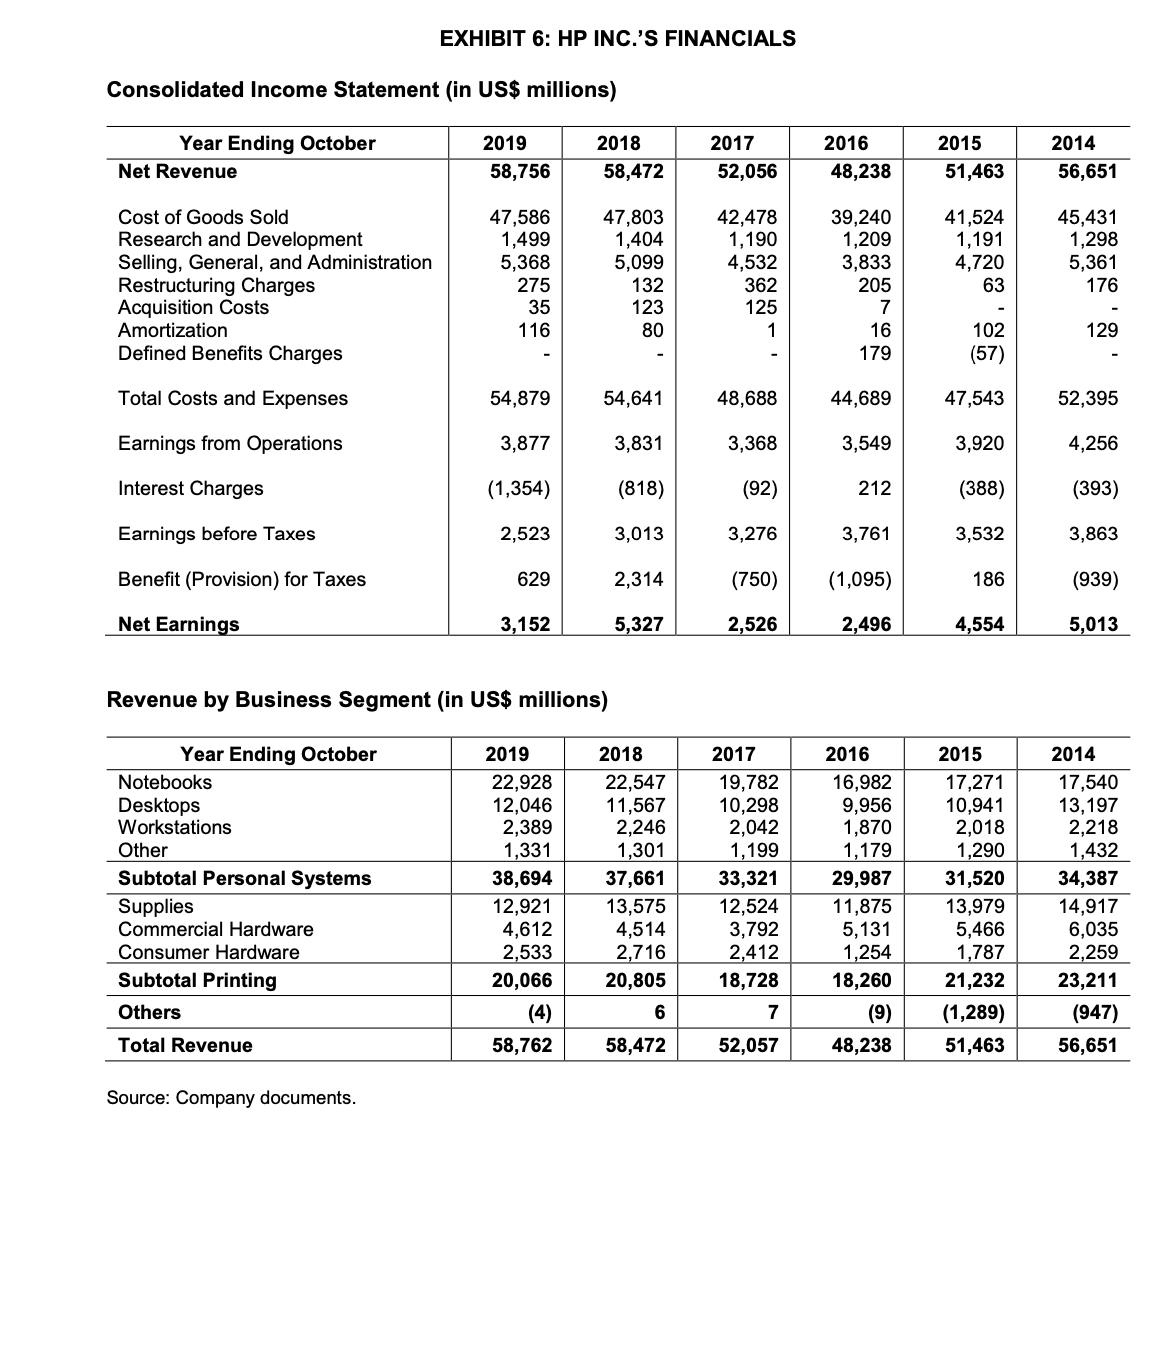
EXHIBIT 1: REVENUE TREND FOR PUBLICLY LISTED 3D COMPANIES (IN US$ MILLIONS) Rank Company Country 2018 2017 2016 2015 3D Systems Corp United States 588 646 633 666 Stratasys Ltd United States/Israel 663 668 673 696 Proto Labs Inc. United States 446 264 298 264 NO UA W N- Materialise NV Belgium 218 161 127 113 SLM Solutions Group AG Germany 85 93 89 73 ExOne Company United States 65 58 49 40 voxeljet AG Germany 31 26 25 27 Total of 7 Companies 2, 196 1,919 1,894 1,879 Industry Total 9,795 7,335 6,064 5,615 Source: "3D Printing Industry Snapshot," J.P. Morgan Equity Research Report, April 1, 2019. EXHIBIT 2: TRADITIONAL MANUFACTURING VERSUS 3D PRINTING-VOLUME VERSUS COST Cost per unit 3D printing Traditional manufacturing Output Source: Benjamin Grynol, Disruptive Manufacturing: The Effects of 3D Printing (Canada: Deloitte LLP, n.d.), 6, https://www2.deloitte.com/content/dam/Deloitte/ca/Documents/insights-and-issues/ca-en-insights-issues-disruptive- manufacturing.pdf. Used with permission.EXHIBIT 3: LEADING HOLDERS OF 3D PRINTING PATENTS Company Country No. of 3D Patents General Electric Company United States 2,516 HP Inc. United States 2,285 United Technologies Corp. United States 1,855 Siemens AG Germany 1,529 3M Company United States 1, 145 3D Systems Corp United States 1,055 Harvard University United States 984 Boeing Co. United Kingdom 933 Stratasys Inc. United States/Israel 769 Xerox Corp. United States 679 Source: "Leading Countries for 3D Printing Patent Applications 2019," Statista, accessed October 19, 2020. EXHIBIT 4: 3D PATENT APPLICATIONS FILED IN 2019, BY COUNTRY Country Number of Applications Filed United States 44,177 China 18,838 Europe 15,049 Germany 10, 199 Great Britain 8,719 Spain 6,744 Austria 6,586 Switzerland 6,579 Sweden 6,557 Denmark 6,456 Portugal 6,383 Source: "Leading Countries for 3D Printing Patent Applications 2019," Statista, accessed October 19, 2020. EXHIBIT 5: MARKET SHARE OF 3D PRINTING, JULY 2018, BY COUNTRY Country Market Share (%) United States 38.1 United Kingdom 15.7 Netherlands 6.7 Germany 6.3 Canada 5.7 Australia 5.7 Singapore 3.9 France 2.5 Italy 1.4 India 1.4 Total 37.4 Source: "3D Printing & Additive Manufacturing Worldwide," Statista, accessed October 19, 2020.EXHIBIT 6: HP INC.'S FINANCIALS Consolidated Income Statement (in US$ millions) Year Ending October 2019 2018 2017 2016 2015 2014 Net Revenue 58,756 58,472 52,056 48,238 51,463 56,651 Cost of Goods Sold 47,586 47,803 42,478 39,240 41,524 45,431 Research and Development 1,499 1,404 1,190 1,209 1, 191 1,298 Selling, General, and Administration 5,368 5,099 4,532 3,833 4,720 5,361 Restructuring Charges 275 132 362 205 63 176 Acquisition Costs 35 123 125 Amortization 116 80 16 102 129 Defined Benefits Charges 179 (57) Total Costs and Expenses 54,879 54,641 48.688 44,689 47,543 52,395 Earnings from Operations 3,877 3,831 3,368 3,549 3,920 4,256 Interest Charges (1,354) (818) (92) 212 388) (393) Earnings before Taxes 2,523 3,013 3,276 3,761 3,532 3,863 Benefit (Provision) for Taxes 629 2,314 (750) (1,095) 186 (939) Net Earnings 3,152 5,327 2,526 2,496 4,554 5,013 Revenue by Business Segment (in US$ millions) Year Ending October 2019 2018 2017 2016 2015 2014 Notebooks 22,928 22,547 19,782 16,982 17,271 17,540 Desktops 12,046 11,567 10,298 9,956 10,941 13, 197 Workstations 2,389 2,246 2,042 1,870 2,018 2,218 Other 1,331 1,301 1, 199 1,179 1,290 1,432 Subtotal Personal Systems 38,694 37,661 33,321 29,987 31,520 34,387 Supplies 12,921 13,575 12,524 11,875 13,979 14,917 Commercial Hardware 4,612 4,514 3,792 5,131 5,466 6,035 Consumer Hardware 2,533 2,716 2,412 1,254 1,787 2,259 Subtotal Printing 20,066 20,805 18,728 18,260 21,232 23,211 Others (4) (9) (1,289) (947) Total Revenue 58,762 58,472 52,057 48,238 51,463 56,651 Source: Company documents
Step by Step Solution
There are 3 Steps involved in it
1 Expert Approved Answer
Step: 1 Unlock
Question Has Been Solved by an Expert!
Get step-by-step solutions from verified subject matter experts
Step: 2 Unlock
Step: 3 Unlock
Students Have Also Explored These Related Finance Questions!