

Question: What is the predicted height l The scatterplot shows the heights of mothers and daughters. Complete parts (a) through (9) 30 below. Daughter = 19.62
What is the predicted height
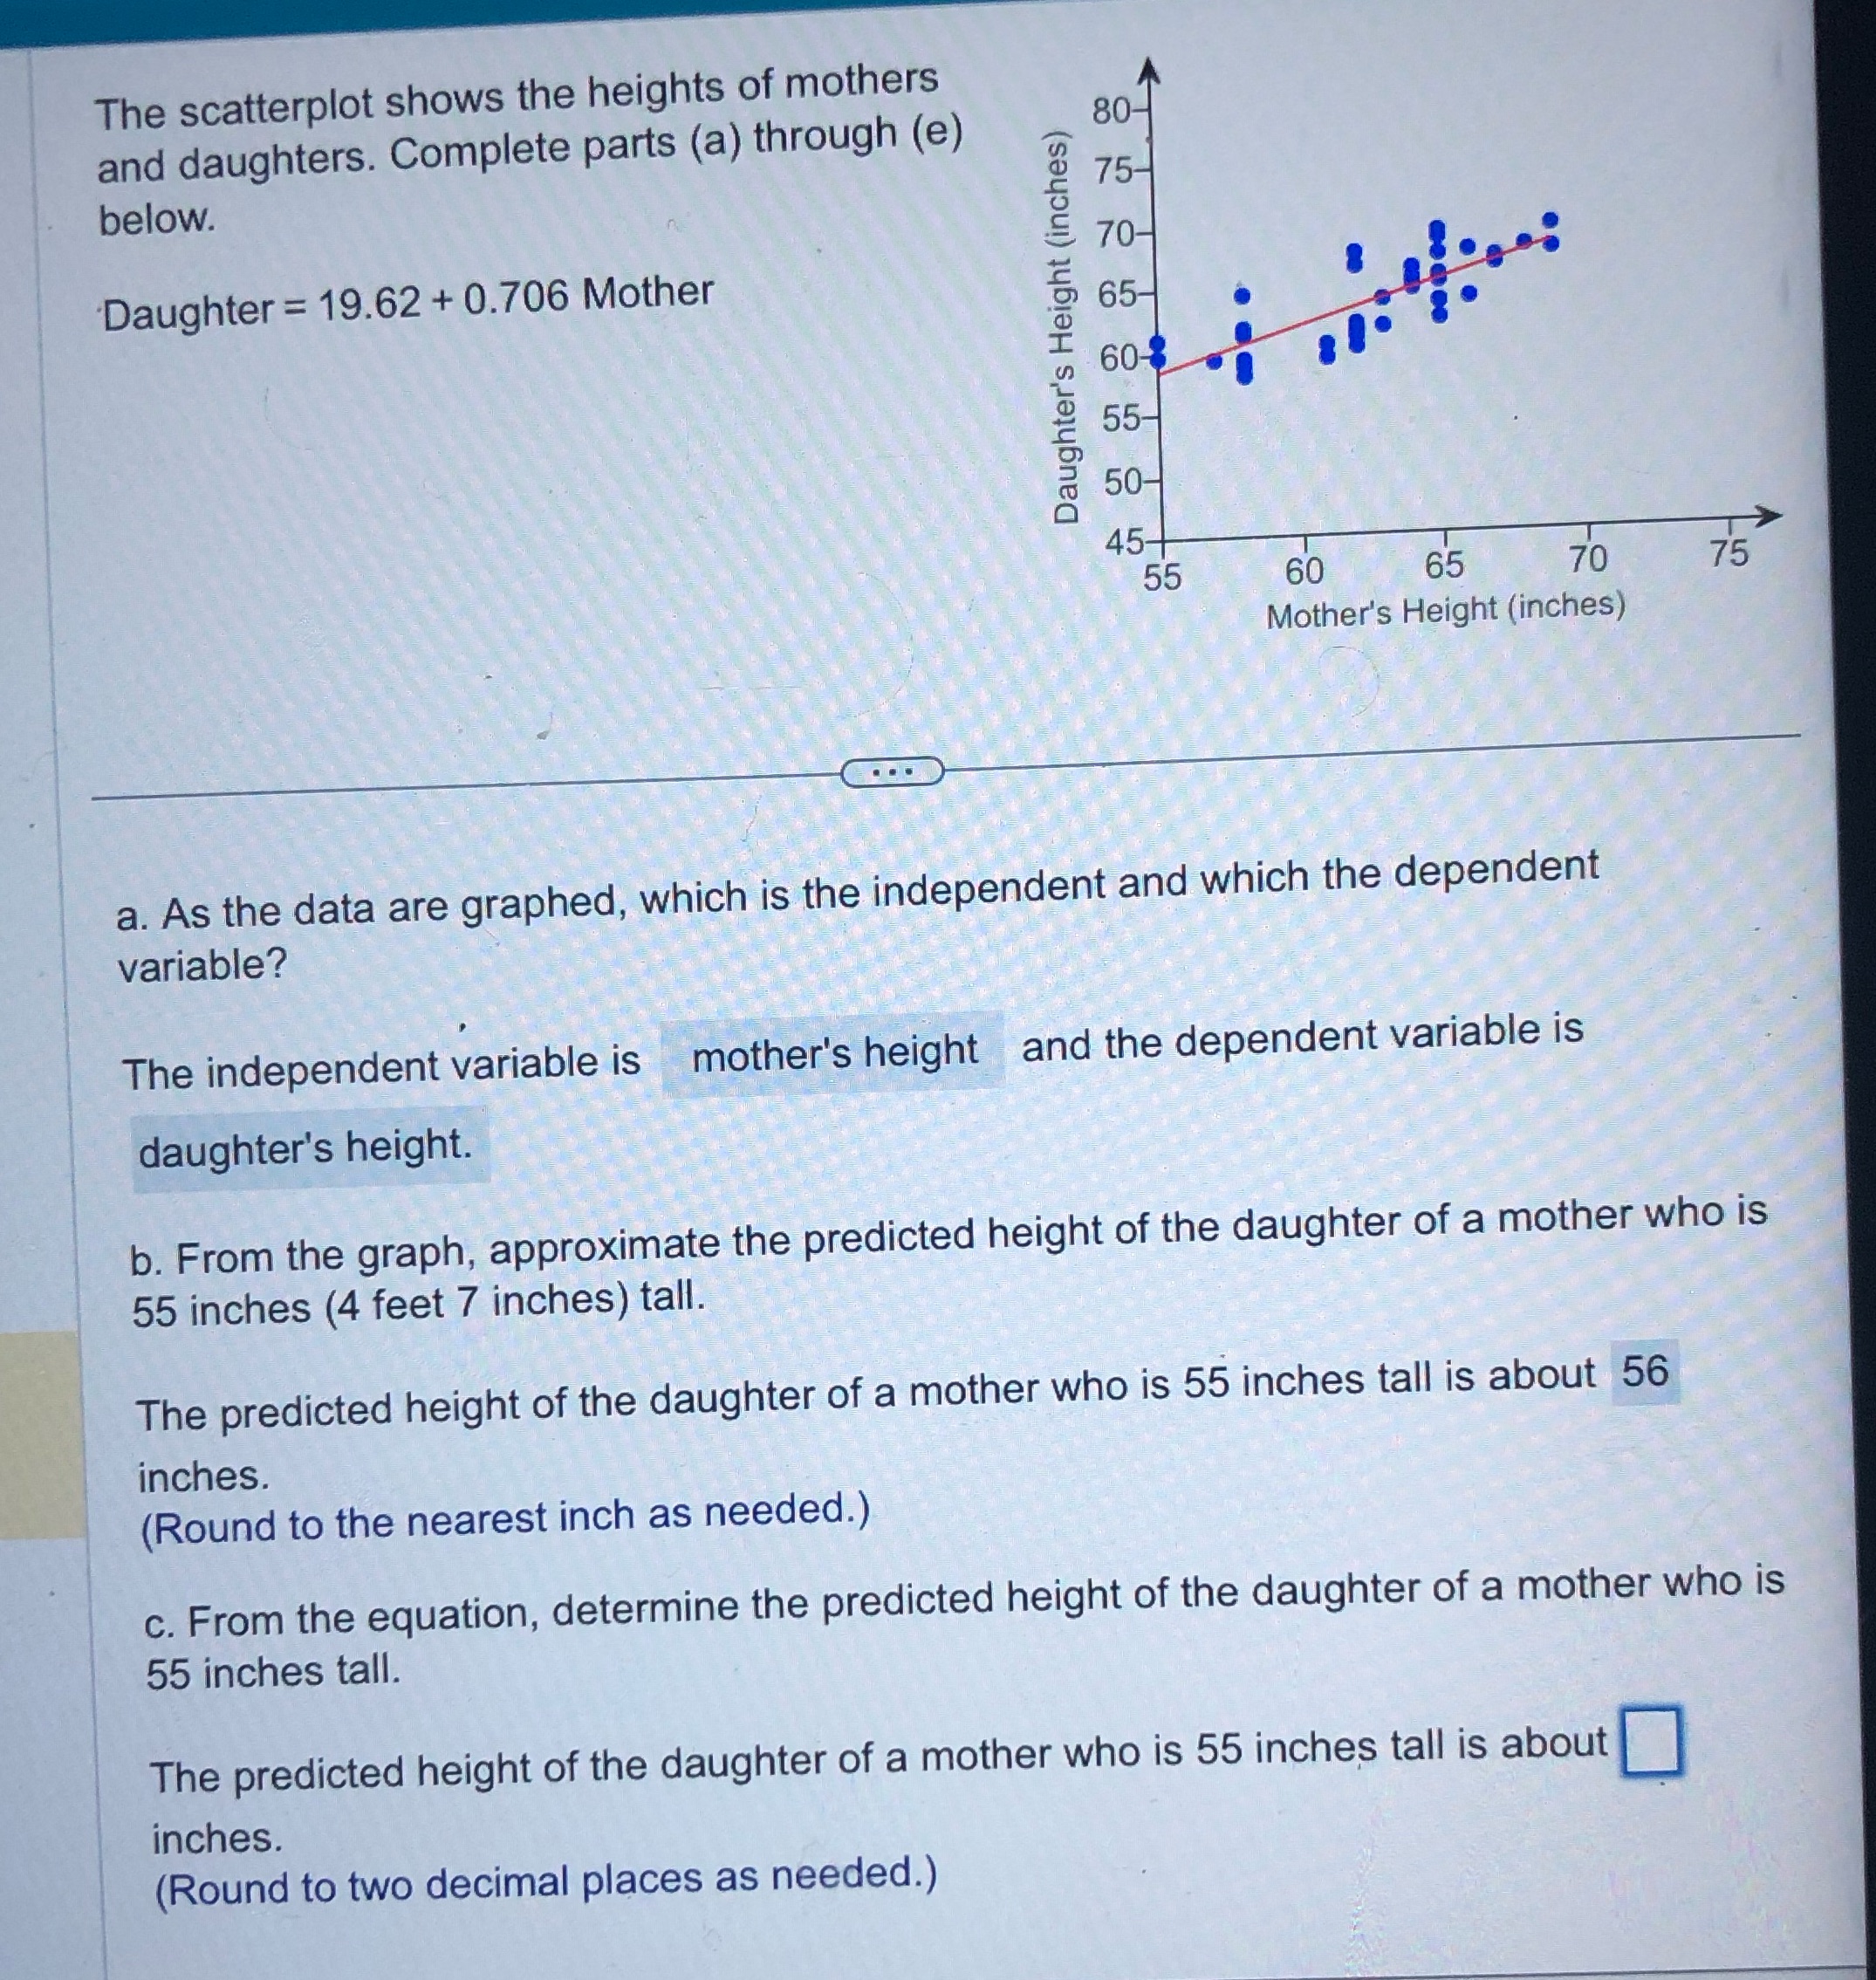
l The scatterplot shows the heights of mothers and daughters. Complete parts (a) through (9) 30 below. Daughter = 19.62 + 0.706 Mother 65 Daughter's Height (inches) 55 60 65 7O 75 Mother's Height (inches) w/ a. As the data are graphed, which is the independent and which the dependent variable? The independent variable is mother's height and the dependent variable is daughter's height. b. From the graph, approximate the predicted height of the daughter of a mother who is 55 inches (4 feet 7 inches) tall. The predicted height of the daughter of a mother who is 55 inches tail is about 56 inches. (Round to the nearest inch as needed.) 0. From the equation, determine the predicted height of the daughter of a mother who is 55 inches tall. The predicted height of the daughter of a mother who is 55 inches tail is about U inches. (Round to two decimal places as needed.)
Step by Step Solution
There are 3 Steps involved in it

Get step-by-step solutions from verified subject matter experts