

Question: What is the probability that the project will be completed in less time than expected? 0.263 0.437 0.563 0.737 What is the probability that the
What is the probability that the project will be completed in less time than expected?
- 0.263
- 0.437
- 0.563
- 0.737
What is the probability that the project will not be completed by the expected time?
- 0.263
- 0.437
- 0.563
- 0.737
What is the probability that the project will be completed no later than the most likely time?
- 0.263
- 0.437
- 0.563
- 0.737
What is the probability that the project will not be completed within the most likely time?
- 0.263
- 0.437
- 0.563
- 0.737
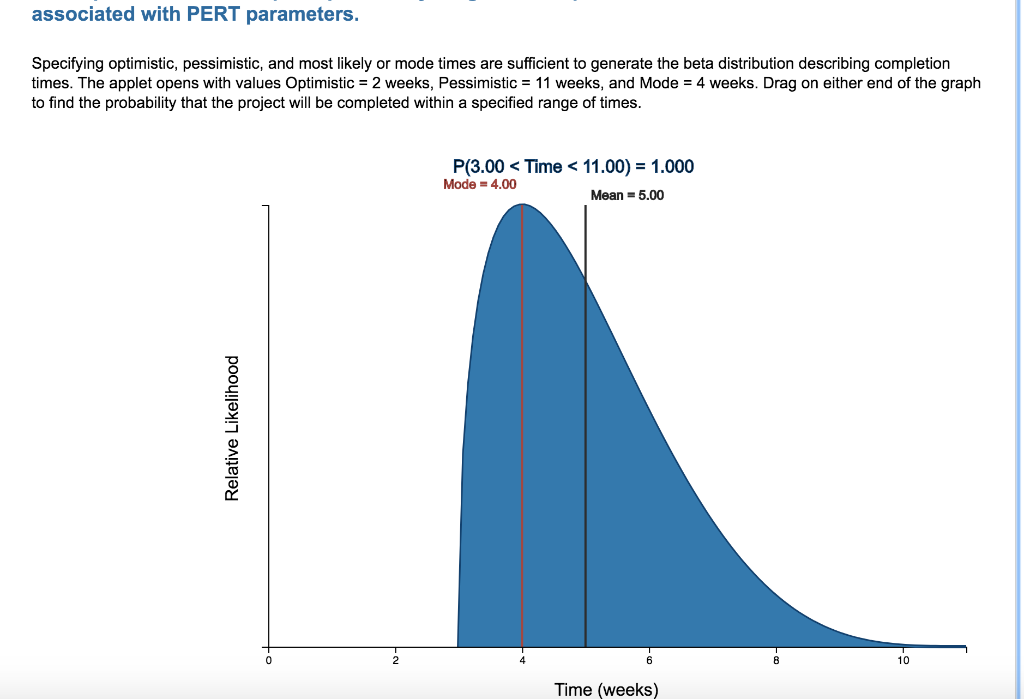
associated with PERT parameters. Specifying optimistic, pessimistic, and most likely or mode times are sufficient to generate the beta distribution describing completion times. The applet opens with values Optimistic = 2 weeks, Pessimistic = 11 weeks, and Mode = 4 weeks. Drag on either end of the graph to find the probability that the project will be completed within a specified range of times. P(3.00
Step by Step Solution
There are 3 Steps involved in it
1 Expert Approved Answer
Step: 1 Unlock

Question Has Been Solved by an Expert!
Get step-by-step solutions from verified subject matter experts
Step: 2 Unlock
Step: 3 Unlock