

Question: What is the quick ratio for Young for 2017? b. What is the debt-equity ratio for 2017? c. what is the inventory turnover for 2018?
What is the quick ratio for Young for 2017?
b. What is the debt-equity ratio for 2017?
c. what is the inventory turnover for 2018?
d. what was the return on equity?
e . what is the day's sales in receivables for 2018?
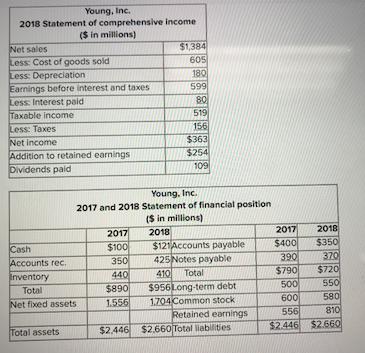
Young, Inc. 2018 Statement of comprehensive income ($ in millions) Net sales Less: Cost of goods sold Less: Depreciation Earnings before interest and taxes Less: Interest paid Taxable income Less: Taxes Net income Addition to retained earnings Dividends paid Cash Accounts rec. Inventory Total Net fixed assets Total assets 2017 $100 350 440 $1,384 605 $890 1.556 180 599 80 Young, Inc. 2017 and 2018 Statement of financial position ($ in millions) 519 156 $363 $254 109 2018 $121 Accounts payable 425 Notes payable 410 Total $956Long-term debt 1.704 Common stock Retained earnings $2,446 $2.660 Total liabilities 2017 $400 390 2018 $350 370 $720 550 580 810 $790 500 600 556 $2.446 $2.660
Step by Step Solution
3.42 Rating (155 Votes )
There are 3 Steps involved in it

Get step-by-step solutions from verified subject matter experts