

Question: What is the slope for the function shown in the table and what does it represent? Question 7 1 pts A large water tank holds
What is the slope for the function shown in the table and what does it represent?
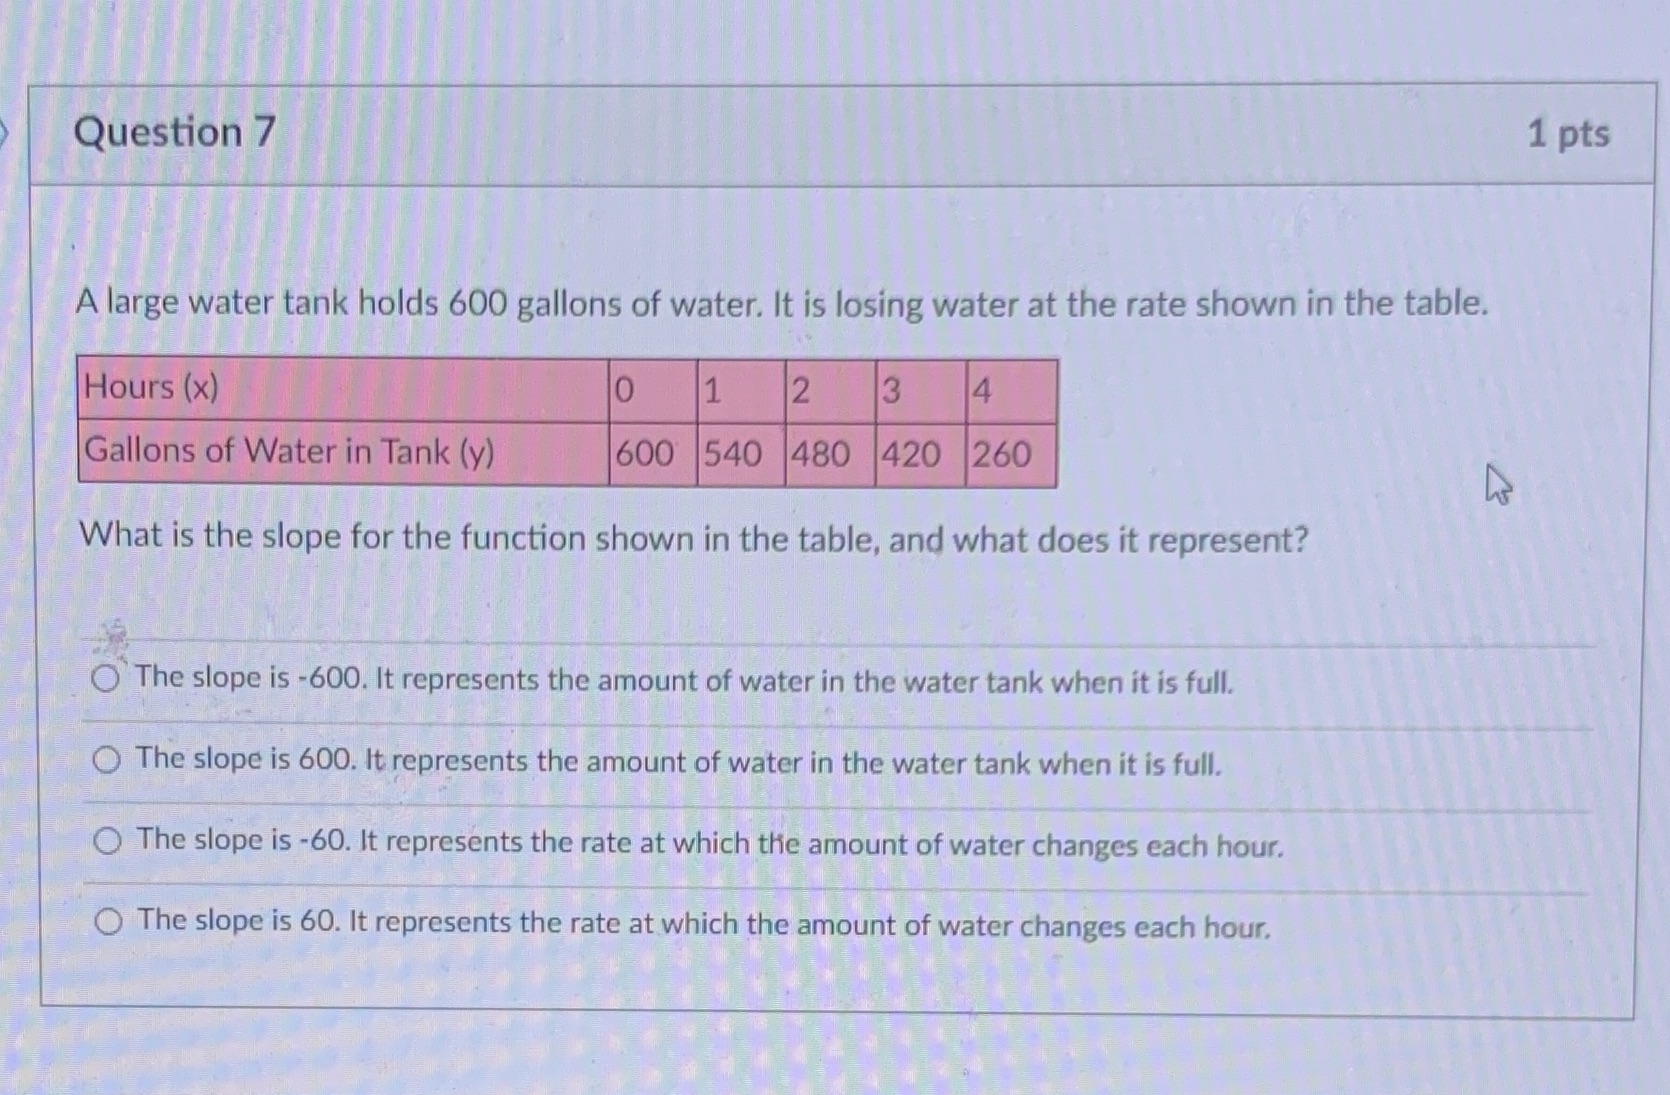
Question 7 1 pts A large water tank holds 600 gallons of water. It is losing water at the rate shown in the table. Hours (x) 1 2 3 4 Gallons of Water in Tank (y) 600 540 480 420 260 What is the slope for the function shown in the table, and what does it represent? O' The slope is -600. It represents the amount of water in the water tank when it is full. O The slope is 600. It represents the amount of water in the water tank when it is full. O The slope is -60. It represents the rate at which the amount of water changes each hour. O The slope is 60. It represents the rate at which the amount of water changes each hour
Step by Step Solution
There are 3 Steps involved in it

Get step-by-step solutions from verified subject matter experts