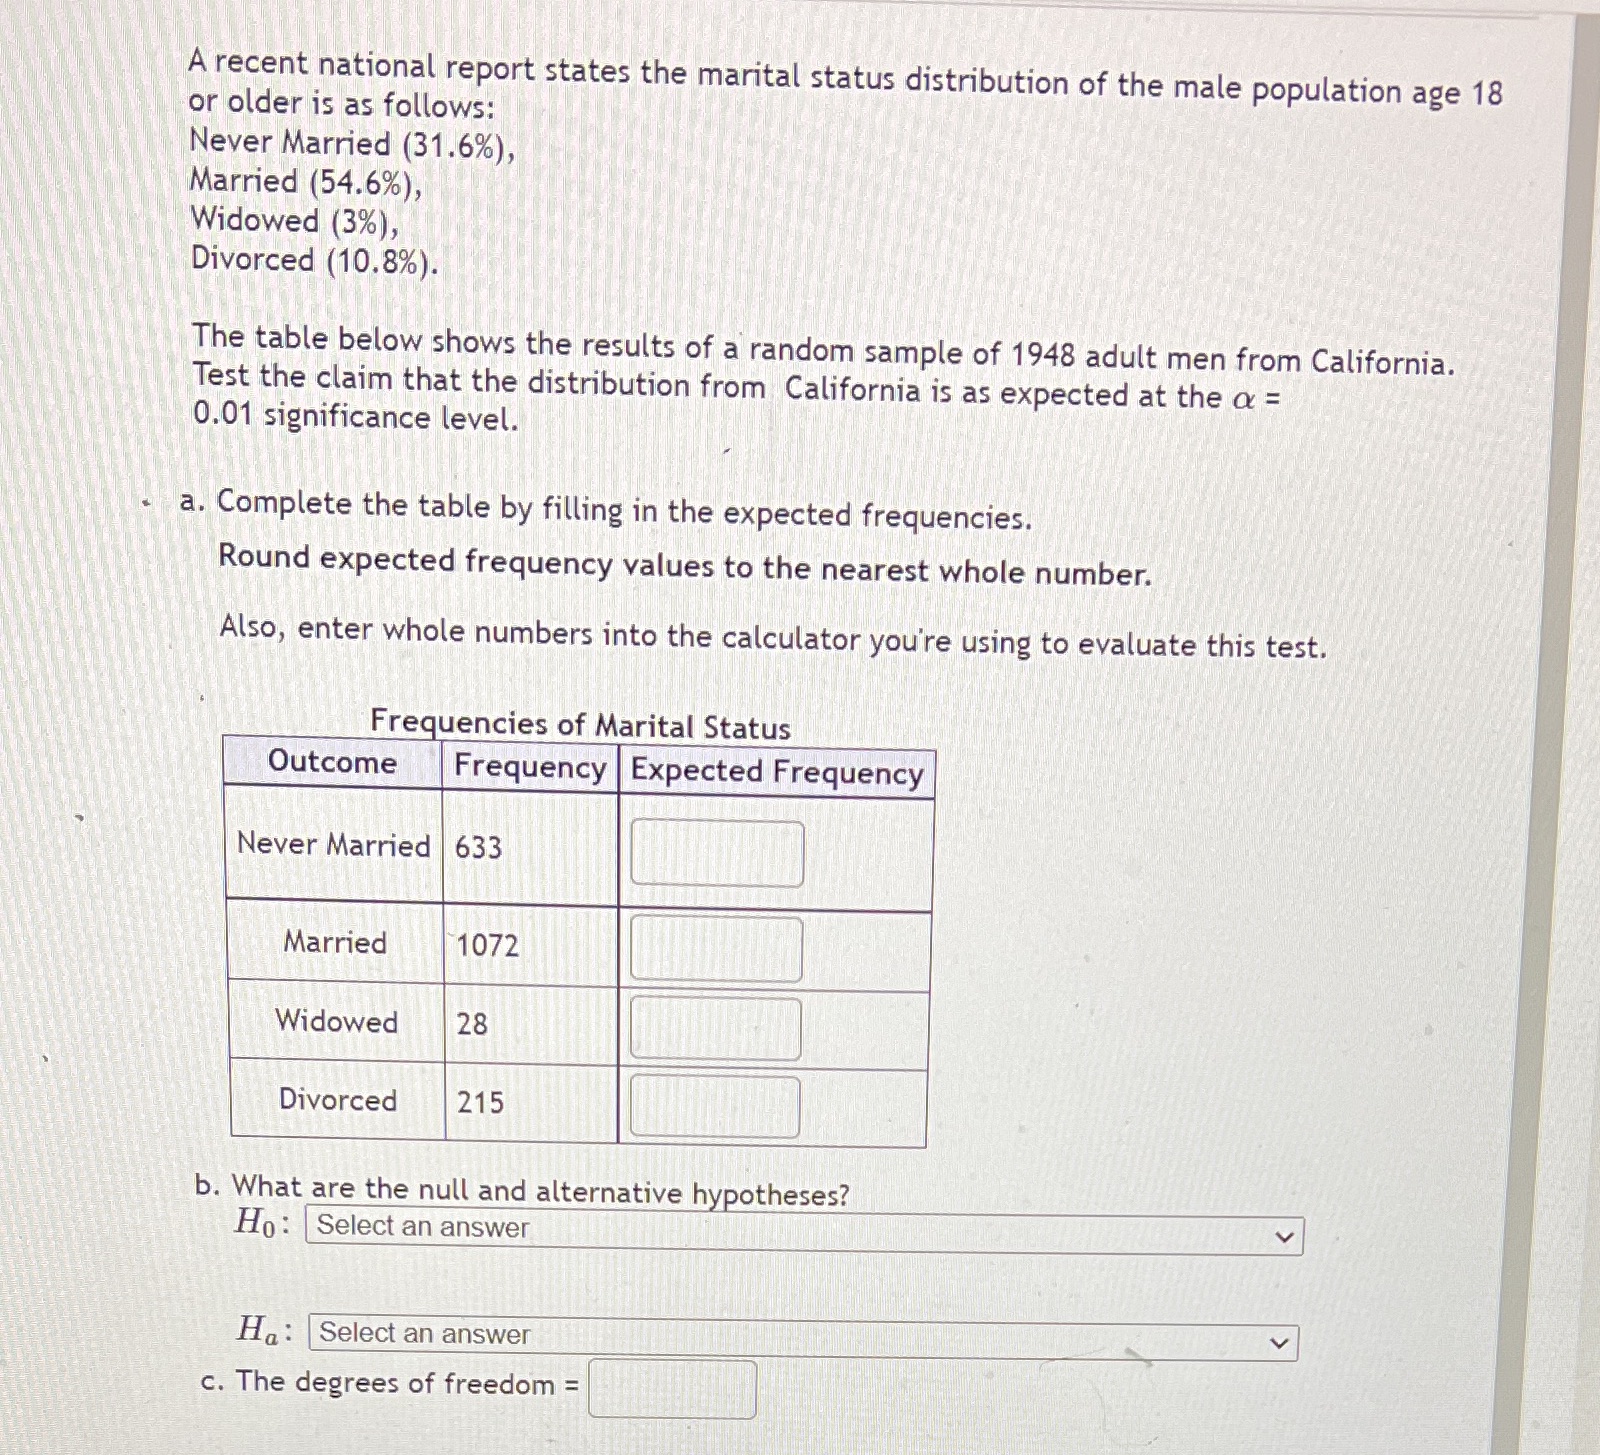
Question: What is the solution ? A recent national report states the marital status distribution of the male population age 18 or older is as follows:

What is the solution ?

What is the solution ? A recent national report
A recent national report states the marital status distribution of the male population age 18 or older is as follows: Never Married (31.6%), Married (54.6%), Widowed (3%), Divorced (10.8%). The table below shows the results of a random sample of 1948 adult men from California. Test the claim that the distribution from California is as expected at the o = 0.01 significance level. a. Complete the table by filling in the expected frequencies. Round expected frequency values to the nearest whole number. Also, enter whole numbers into the calculator you're using to evaluate this test. Frequencies of Marital Status Outcome Frequency Expected Frequency Never Married 633 Married 1072 Widowed 28 Divorced 215 b. What are the null and alternative hypotheses? Ho: Select an answer Ha: Select an answer c. The degrees of freedom =

Step by Step Solution

There are 3 Steps involved in it

1 Expert Approved Answer
Step: 1 Unlock blur-text-image
Question Has Been Solved by an Expert!

Get step-by-step solutions from verified subject matter experts

Step: 2 Unlock
Step: 3 Unlock

Students Have Also Explored These Related Mathematics Questions!