

Question: What is the t value with a 90% confidence interval for the true population mean if the sample size n = 30? (Please keep

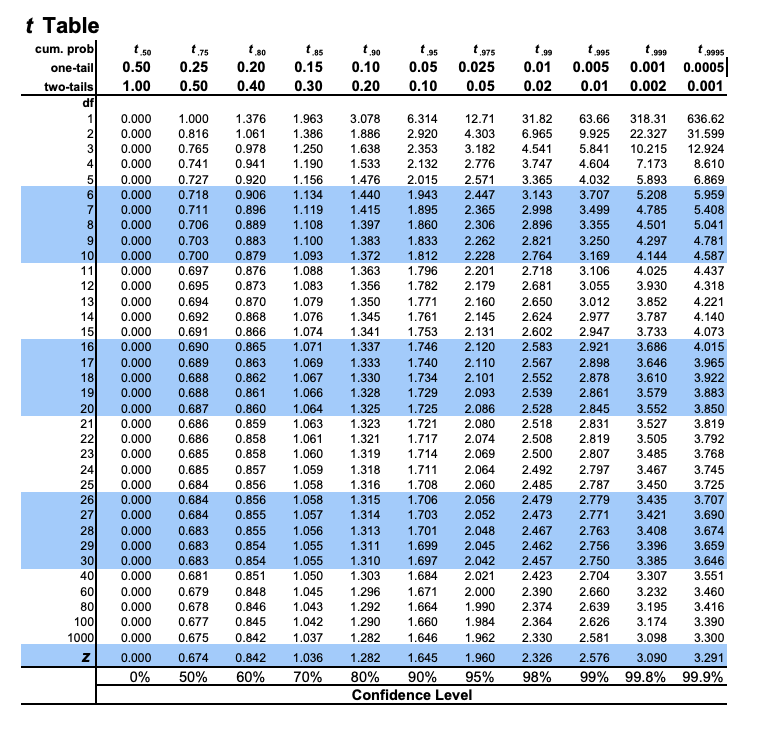
What is the t value with a 90% confidence interval for the true population mean if the sample size n = 30? (Please keep three decimal places) t value = t Table cum. prob t.50 one-tail 0.50 two-tails 1.00 0.50 df 1 0.000 2 0.000 3 0.000 4 0.000 5 0.000 6 0.000 7 0.000 8 0.000 9 10 11 12 13 14 15 16 17 18 19 20 21 22 23 24 25 26 27 28 29 30 40 N 1.75 t.80 0.25 0.20 0.40 0.000 0.000 0.000 0.000 0.000 0.000 0.000 0.000 1.000 1.963 3.078 6.314 12.71 10.215 7.173 4.032 5.893 0.718 3.707 5.208 0.711 0.896 1.119 3.499 4.785 5.408 1.376 0.816 1.061 1.386 1.886 2.920 4.303 6.965 9.925 22.327 0.765 0.978 1.250 1.638 2.353 3.182 4.541 5.841 0.741 0.941 1.190 1.533 2.132 2.776 3.747 4.604 0.727 0.920 1.156 1.476 2.015 2.571 3.365 0.906 1.134 1.440 1.943 2.447 3.143 1.415 1.895 2.365 2.998 1.397 1.860 2.306 2.896 3.355 1.383 1.833 2.262 2.821 3.250 1.372 1.812 2.228 2.764 3.169 1.363 1.796 2.201 2.718 3.106 1.356 1.782 2.179 2.681 3.055 3.930 1.350 1.771 2.160 2.650 1.345 1.761 2.145 2.624 2.977 0.706 0.889 4.501 5.041 0.703 0.883 4.297 4.781 4.144 4.587 1.108 1.100 0.700 0.879 1.093 0.697 0.876 1.088 0.695 0.873 1.083 0.694 0.870 1.079 0.868 1.076 4.025 4.437 4.318 3.012 3.852 0.692 3.787 0.691 1.753 2.131 2.602 2.947 3.733 0.866 0.690 0.865 1.071 1.074 1.341 1.337 2.921 3.686 3.965 3.610 3.922 0.000 0.000 3.883 3.850 1.746 2.120 2.583 0.000 0.689 0.863 1.069 1.333 1.740 2.110 2.567 2.898 3.646 0.688 0.862 1.067 1.330 1.734 2.101 2.552 2.878 0.688 0.861 1.066 1.328 1.729 2.093 2.539 2.861 3.579 0.000 0.687 0.860 1.064 1.325 1.725 2.086 2.528 2.845 3.552 0.000 0.686 0.859 1.063 1.323 1.721 2.080 2.518 2.831 3.527 3.819 0.000 0.686 0.858 1.061 1.321 1.717 2.074 2.508 2.819 3.505 3.792 0.000 0.685 0.858 1.060 1.319 1.714 2.069 2.500 2.807 3.485 3.768 0.000 0.685 0.857 1.059 1.318 1.711 2.064 2.492 2.797 3.467 0.000 0.684 0.856 1.058 1.316 1.708 2.060 2.485 2.787 3.450 0.684 0.856 1.058 1.315 1.706 2.056 2.479 2.779 3.435 3.707 1.314 1.703 2.052 2.473 2.771 2.048 2.467 2.763 2.045 2.462 2.756 3.396 3.745 3.725 0.000 0.000 0.684 0.855 1.057 3.421 3.690 0.000 0.855 1.056 1.701 3.408 3.674 0.000 0.854 1.055 1.699 3.659 0.000 0.854 1.055 1.697 2.042 2.750 3.385 3.646 2.457 2.423 2.704 3.307 0.000 0.851 1.050 1.684 2.021 3.551 1.045 1.296 1.671 2.000 2.390 2.660 3.232 3.460 1.043 1.292 1.664 1.990 2.374 2.639 3.195 3.416 1.290 1.660 1.984 2.364 2.626 3.174 3.390 0.845 1.042 0.842 1.037 1.282 1.646 1.962 2.330 2.581 3.098 3.300 1.282 1.645 80% 90% 95% Confidence Level 3.291 99.9% 0.683 0.683 0.683 0.681 0.000 0.679 0.848 0.000 0.678 0.846 60 80 100 0.000 0.677 1000 0.000 0.675 0.000 0.674 0% 50% t.90 t.95 t 85 0.15 0.10 0.05 0.30 0.20 0.10 0.05 t 905 199 t 975 0.025 0.01 0.005 0.02 0.842 1.036 60% 70% 1.313 1.311 1.310 1.303 t 999 t 1995 0.001 0.0005 0.01 0.002 0.001 31.82 63.66 318.31 636.62 31.599 12.924 8.610 6.869 5.959 1.960 2.326 98% 2.576 3.090 99% 99.8% 4.221 4.140 4.073 4.015
Step by Step Solution
3.47 Rating (160 Votes )
There are 3 Steps involved in it
Given sample size n30 dfn1 df29 a010 using t tablet value with 90 CI with 29 df is 1699 t value 1699 ... View full answer

Get step-by-step solutions from verified subject matter experts