

Question: What is the test stat , p value , critical value , and hypothesis claim step by step . The right hand is 119, 112,
What is the test stat , p value , critical value , and hypothesis claim step by step . The right hand is 119, 112, 145, 171,200 and the left hand is 127,131,156 191,212 .
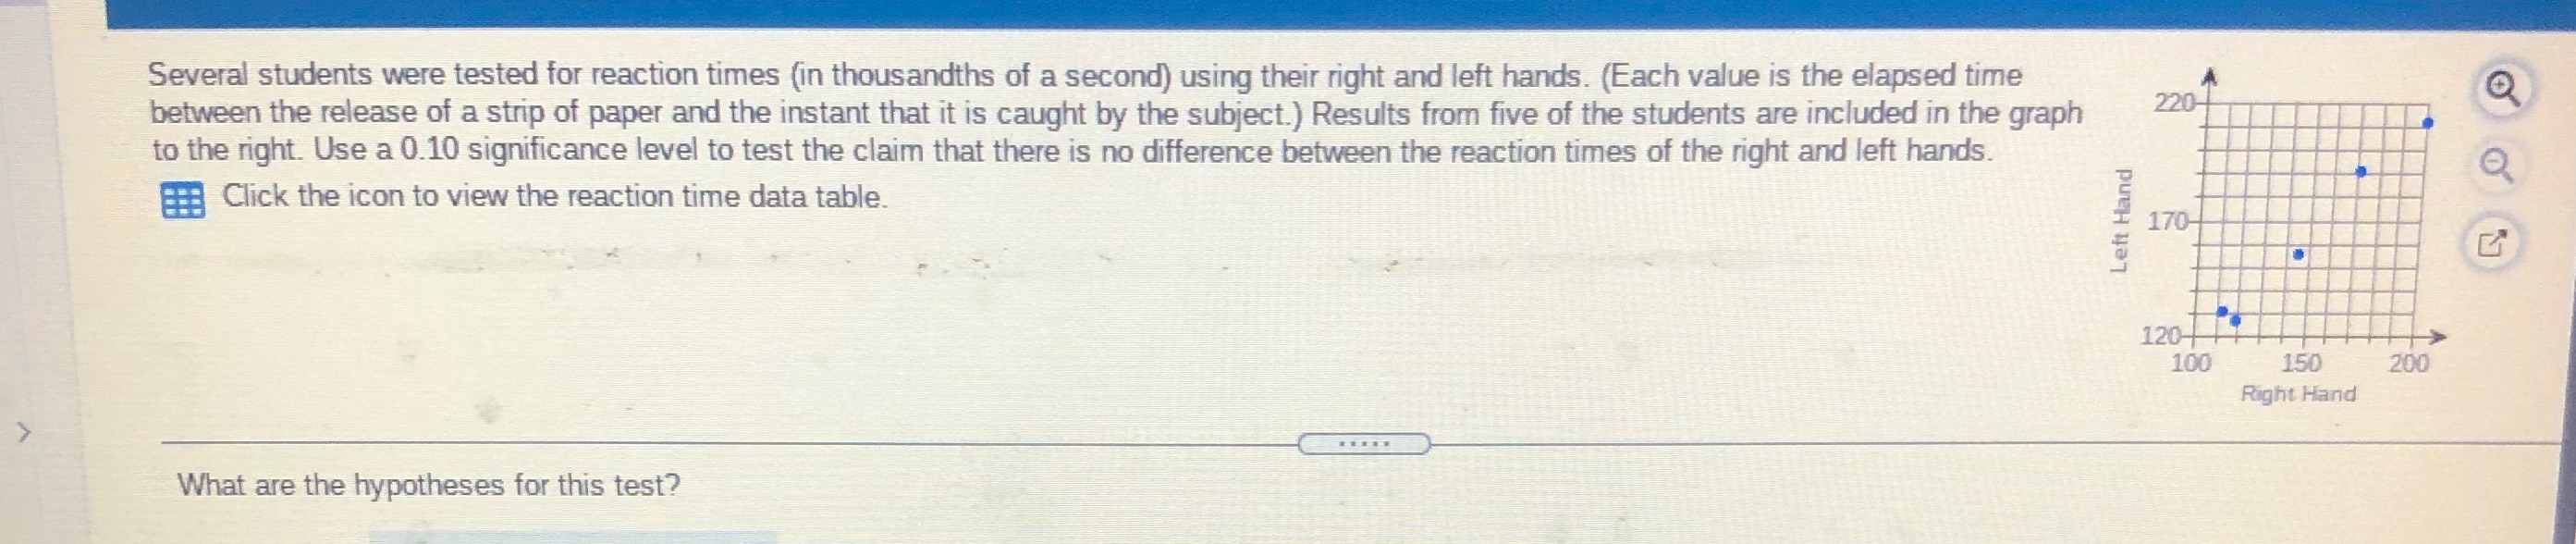
Several students were tested for reaction times (in thousandths of a second) using their right and left hands. (Each value is the elapsed time between the release of a strip of paper and the instant that it is caught by the subject.) Results from five of the students are included in the graph 220- to the right. Use a 0.10 significance level to test the claim that there is no difference between the reaction times of the right and left hands. Click the icon to view the reaction time data table. Left Hand 170 120 100 150 200 Right Hand What are the hypotheses for this test
Step by Step Solution
There are 3 Steps involved in it

Get step-by-step solutions from verified subject matter experts