

Question: What is the test statistics and square In a study of the accuracy of fast food drive-through orders, one restaurant had 37 orders that were
What is the test statistics and square
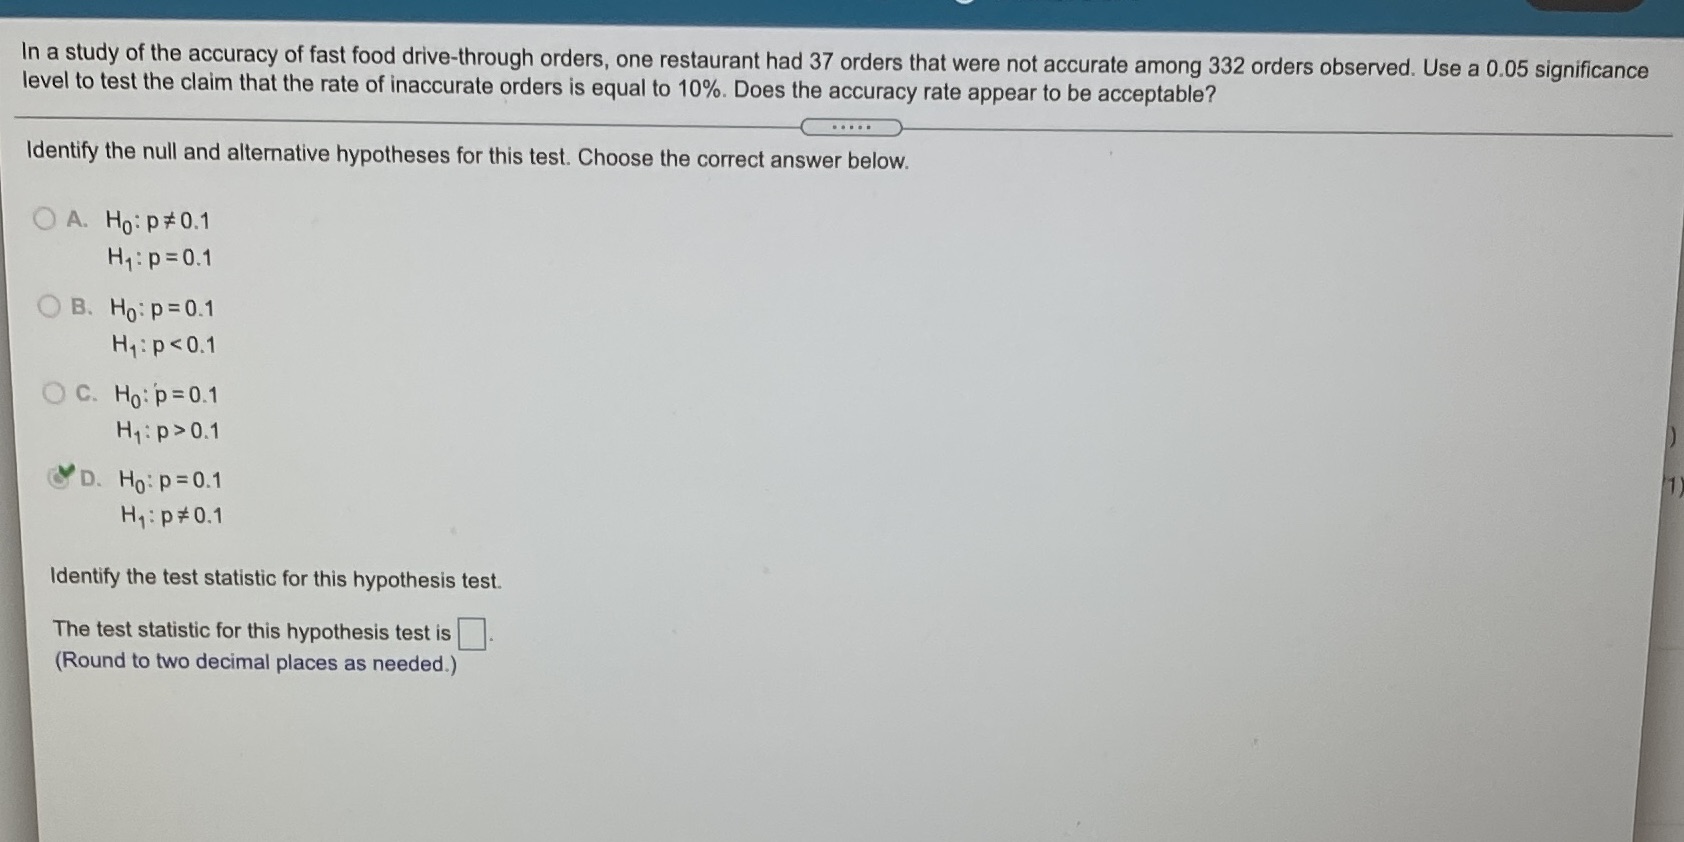
In a study of the accuracy of fast food drive-through orders, one restaurant had 37 orders that were not accurate among 332 orders observed. Use a 0.05 significance level to test the claim that the rate of inaccurate orders is equal to 10%. Does the accuracy rate appear to be acceptable? . . . . . Identify the null and alternative hypotheses for this test. Choose the correct answer below. OA. Ho: p # 0.1 H1 : p = 0.1 O B. Ho: P = 0.1 H1 : p 0.1 &D. Ho: P = 0.1 H1 : p # 0.1 Identify the test statistic for this hypothesis test. The test statistic for this hypothesis test is (Round to two decimal places as needed.)
Step by Step Solution
There are 3 Steps involved in it

Get step-by-step solutions from verified subject matter experts