

Question: What is the test statistics in this problem? 7.3.4 In a study of parents' perceptions of their children's size, researchers Kaufman et al. (Current Biology,
What is the test statistics in this problem?
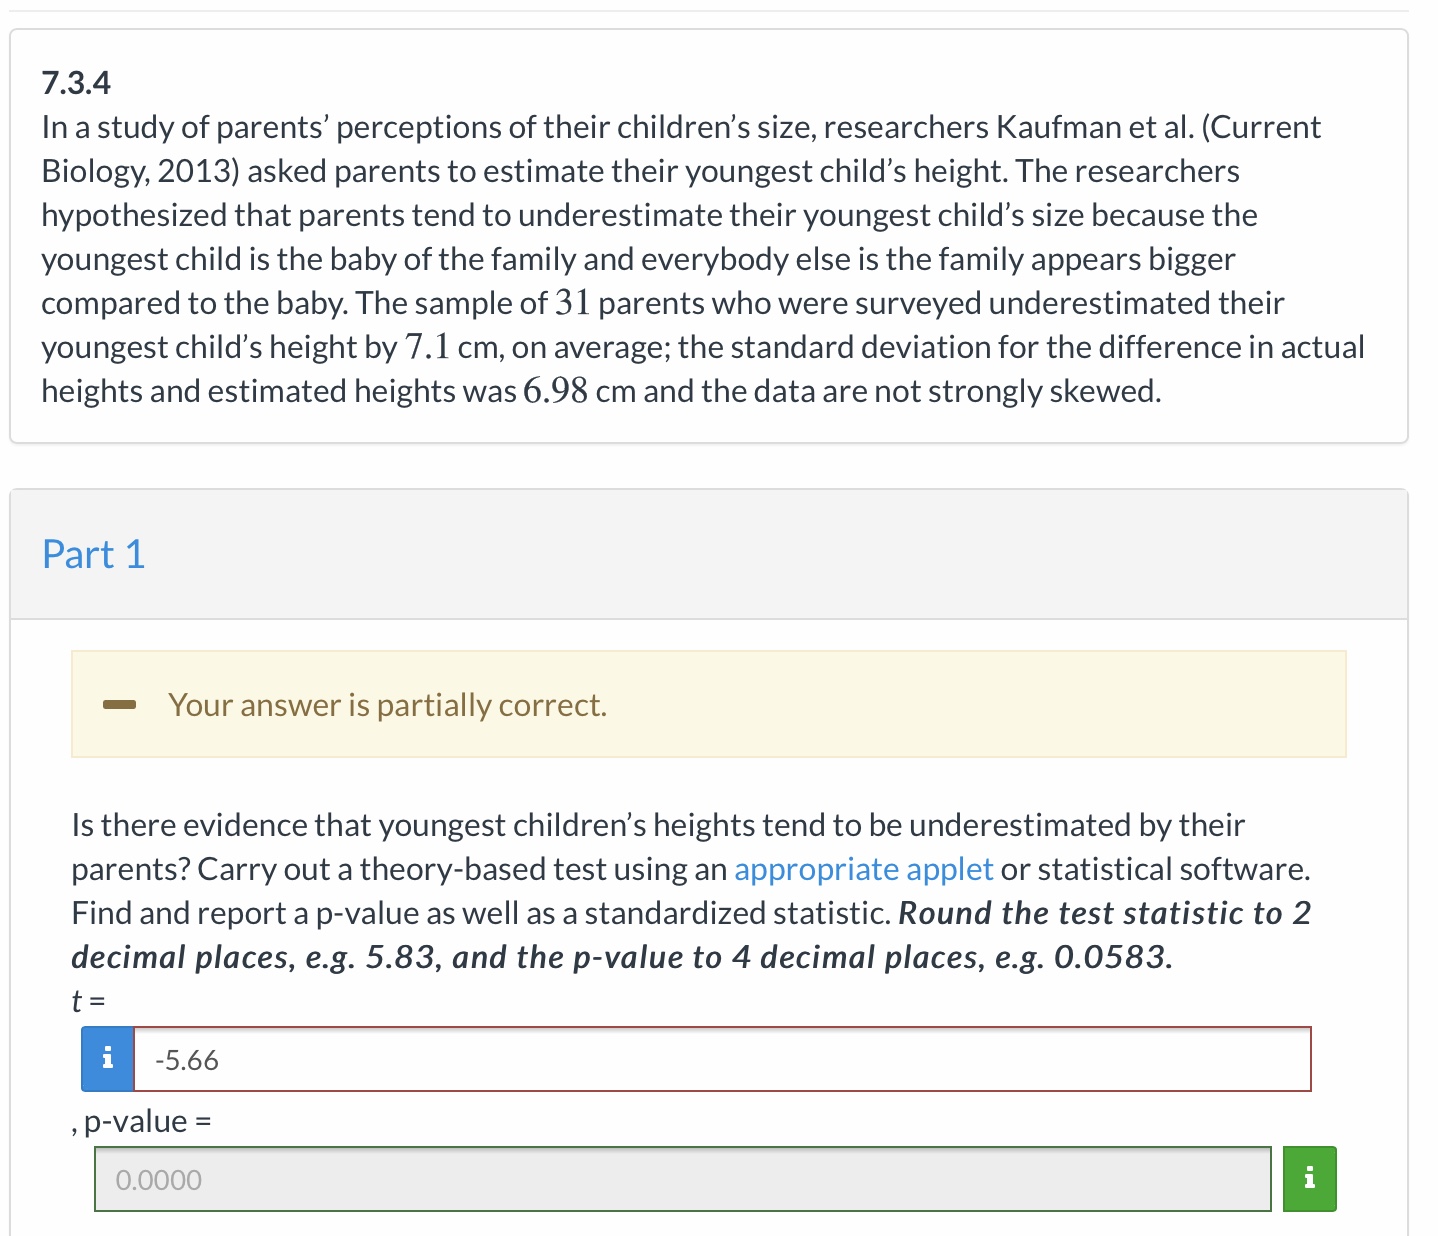
7.3.4 In a study of parents' perceptions of their children's size, researchers Kaufman et al. (Current Biology, 2013) asked parents to estimate their youngest child's height. The researchers hypothesized that parents tend to underestimate their youngest child's size because the youngest child is the baby of the family and everybody else is the family appears bigger compared to the baby. The sample of 31 parents who were surveyed underestimated their youngest child's height by 7.1 cm, on average; the standard deviation for the difference in actual heights and estimated heights was 6.98 cm and the data are not strongly skewed. Part 1 Your answer is partially correct. Is there evidence that youngest children's heights tend to be underestimated by their parents? Carry out a theory-based test using an appropriate applet or statistical software. Find and report a p-value as well as a standardized statistic. Round the test statistic to 2 decimal places, e.g. 5.83, and the p-value to 4 decimal places, e.g. 0.0583. t= ,p-value = 0.0000 n
Step by Step Solution
There are 3 Steps involved in it

Get step-by-step solutions from verified subject matter experts