

Question: What is the trend in this run chart? What are the bottleneck can you see? 20 20 Seconds 15 10 10 5 Task 2
What is the trend in this run chart?
What are the bottleneck can you see?
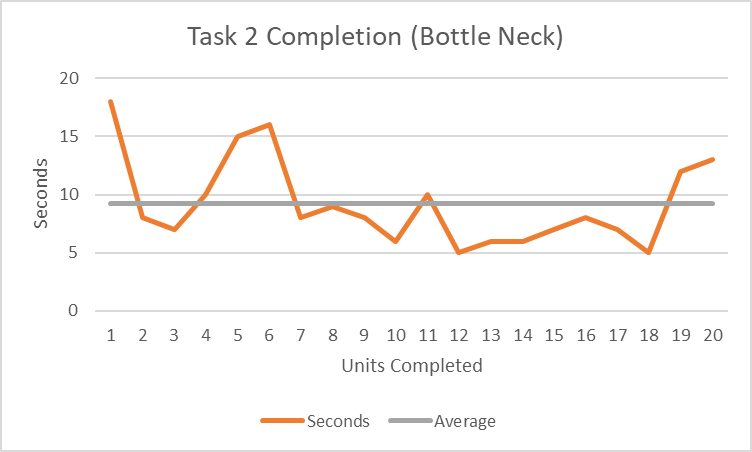
20 20 Seconds 15 10 10 5 Task 2 Completion (Bottle Neck) 0 1 2 3 4 5 6 7 8 9 10 11 12 13 14 15 16 17 18 19 20 Units Completed Seconds Average
Step by Step Solution
There are 3 Steps involved in it
1 Expert Approved Answer
Step: 1 Unlock

Question Has Been Solved by an Expert!
Get step-by-step solutions from verified subject matter experts
Step: 2 Unlock
Step: 3 Unlock