

Question: What is the Upper Control Limit for the mean chart (x-bar chart)? x What is the Lower Control Limit for the mean chart (x-bar chart)?
What is the Upper Control Limit for the mean chart (x-bar chart)?
x
What is the Lower Control Limit for the mean chart (x-bar chart)?
x
What is the Upper Control Limit for the range chart?
x
What is the Lower Control Limit for the range chart?
x
The process is in control and why
x
The upper and lower tolerance limits are 81 and 79, respectively, and the process standard deviation is 0.58. The process is considered capable. and why
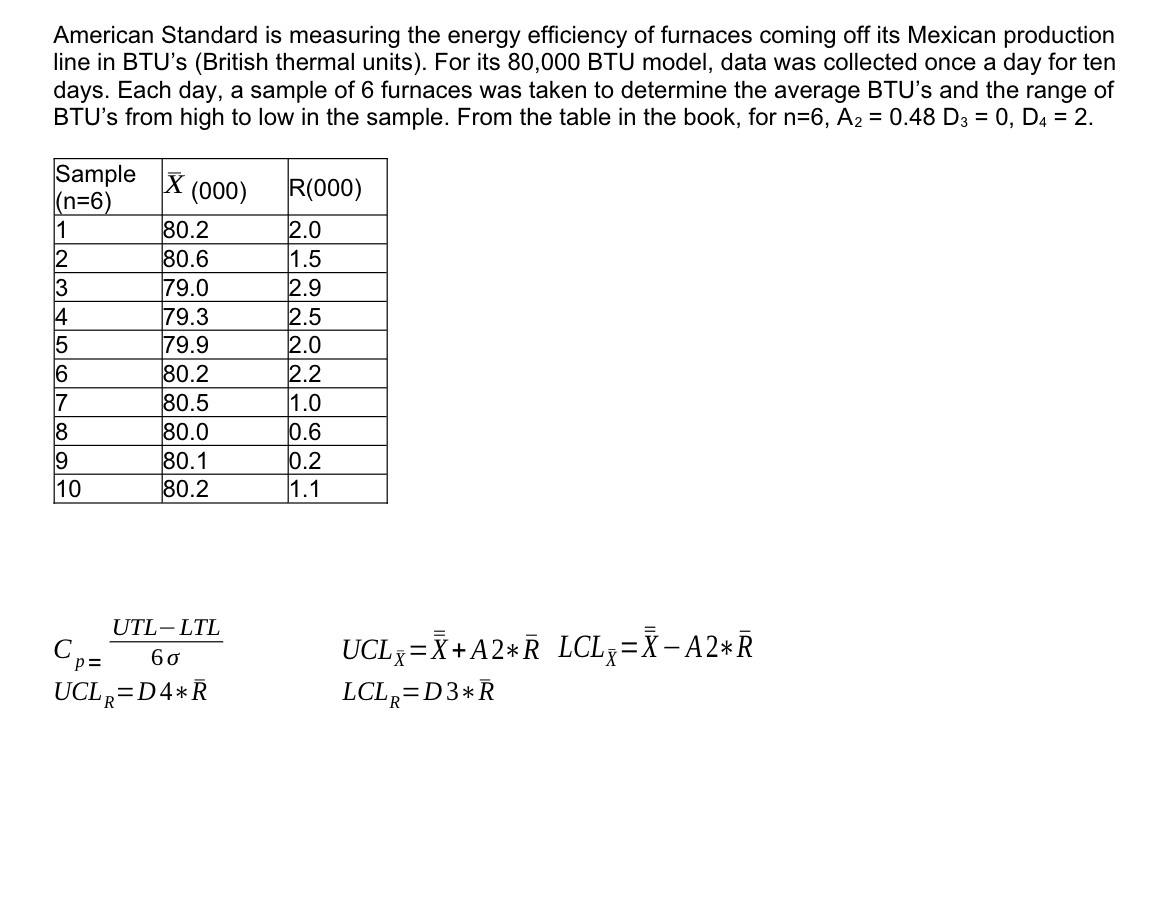
American Standard is measuring the energy efficiency of furnaces coming off its Mexican production line in BTU's (British thermal units). For its 80,000 BTU model, data was collected once a day for ten days. Each day, a sample of 6 furnaces was taken to determine the average BTU's and the range of BTU's from high to low in the sample. From the table in the book, for n=6,A2=0.48D3=0,D4=2. Cp=6UTLLTLUCLR=D4RUCLX=X+A2RLCLX=XA2RLCLR=D3R
Step by Step Solution
There are 3 Steps involved in it

Get step-by-step solutions from verified subject matter experts