

Question: What is the WACC conceptually? How exactly does the WACC influence the DCF valuation? How is beta usually estimated? Which market index should be used?
- What is the WACC conceptually?
- How exactly does the WACC influence the DCF valuation?
- How is beta usually estimated? Which market index should be used?
- Compare your estimate of the firms levered beta with that of CIQ (CIQ Peer Analysis/Quick Comps, Operating Statistics, 5 Year Beta). Explain any differences.
- Calculate the WACC and DCF based on
- your own, and
- CIQs levered beta estimate.
- Compare these two DCF valuations with the markets current share price. Explain any differences.
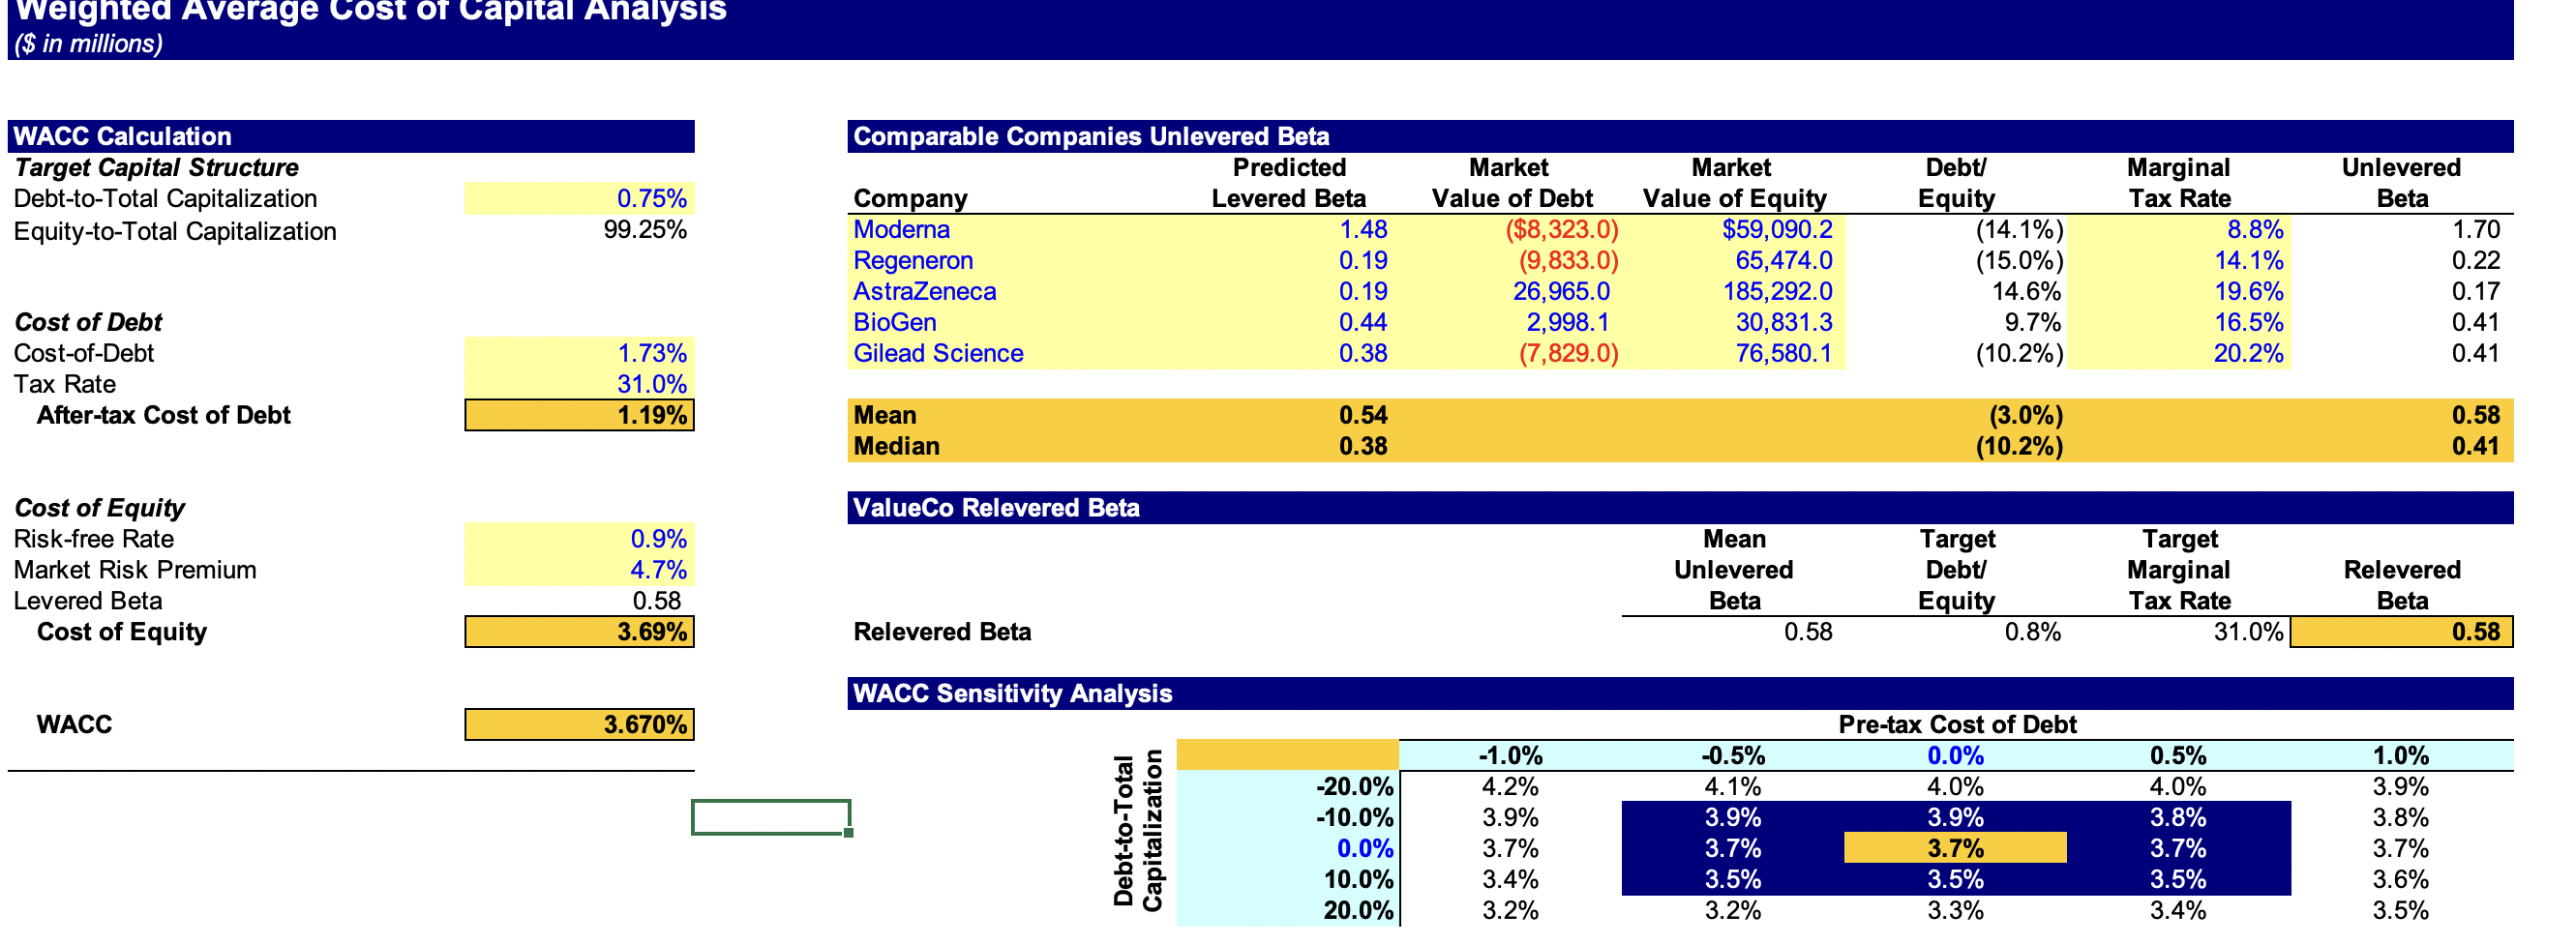
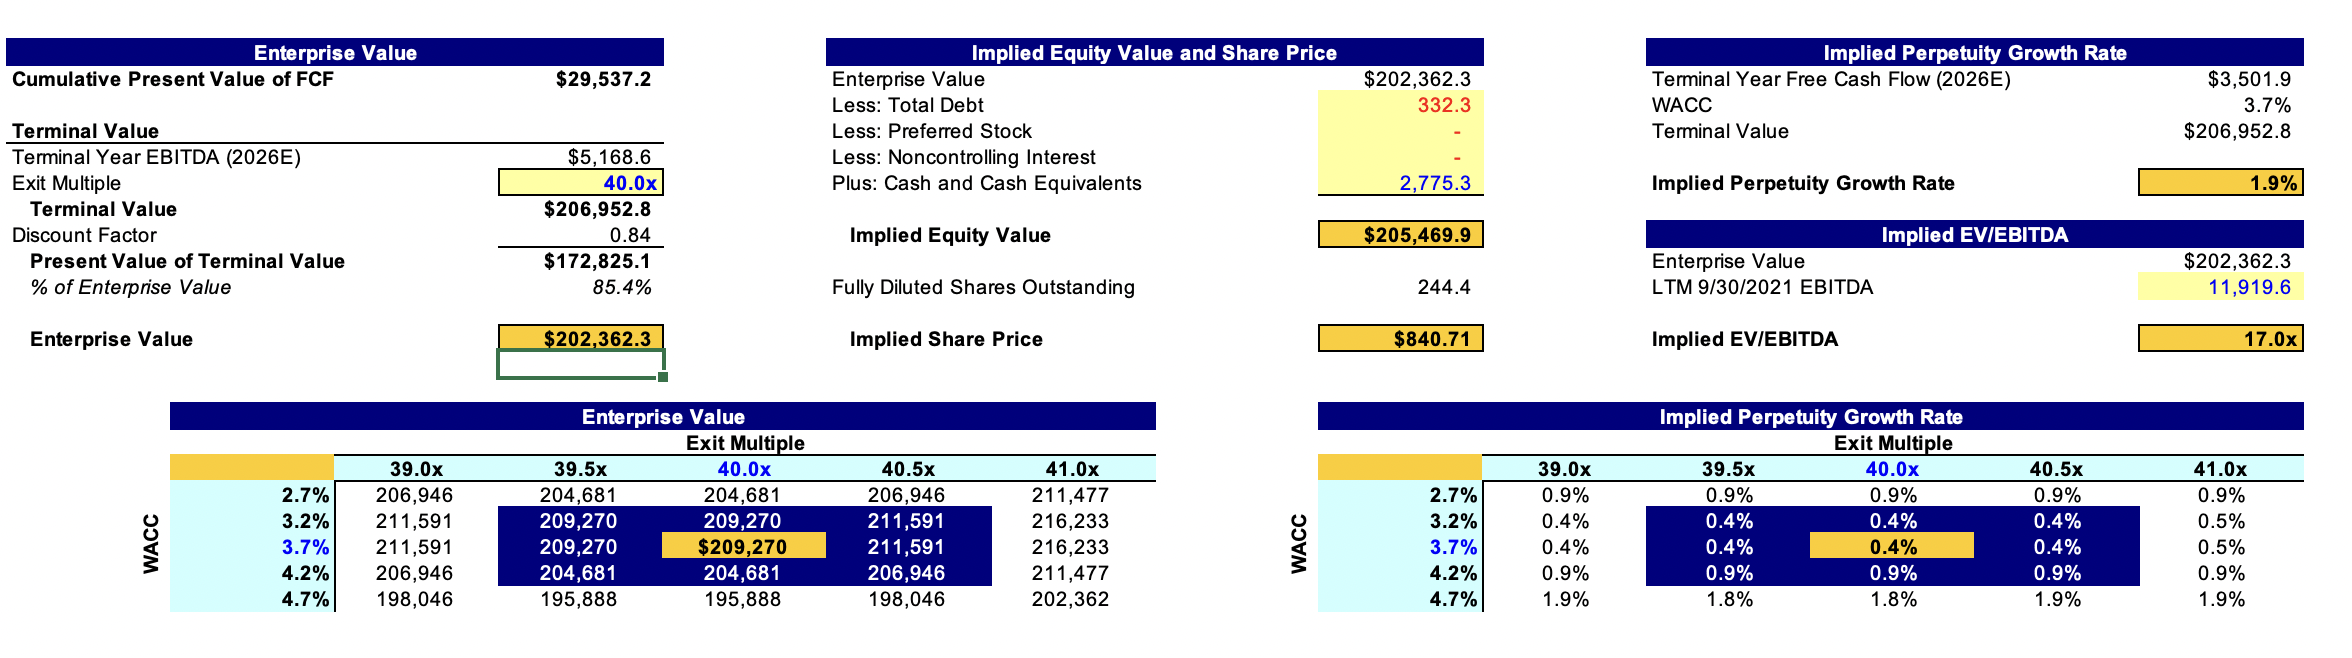
Weighted Average Cost of Capital Analysis ($ in millions) WACC Calculation Target Capital Structure Debt-to-Total Capitalization Equity-to-Total Capitalization 0.75% 99.25% Comparable Companies Unlevered Beta Predicted Company Levered Beta Moderna 1.48 Regeneron 0.19 AstraZeneca 0.19 BioGen 0.44 Gilead Science 0.38 Market Value of Debt ($8,323.0) (9,833.0) 26,965.0 2,998.1 (7,829.0) Market Value of Equity $59,090.2 65,474.0 185,292.0 30,831.3 76,580.1 Debt Equity (14.1%) (15.0%) 14.6% 9.7% (10.2%) Marginal Tax Rate 8.8% 14.1% 19.6% 16.5% 20.2% Unlevered Beta 1.70 0.22 0.17 0.41 0.41 Cost of Debt Cost-of-Debt Tax Rate After-tax Cost of Debt 1.73% 31.0% 1.19% Mean Median 0.54 0.38 (3.0%) (10.2%) 0.58 0.41 ValueCo Relevered Beta Cost of Equity Risk-free Rate Market Risk Premium Levered Beta Cost of Equity 0.9% 4.7% 0.58 3.69% Mean Unlevered Beta 0.58 Target Debt/ Equity 0.8% Target Marginal Tax Rate 31.0% Relevered Beta 0.58 Relevered Beta WACC Sensitivity Analysis WACC 3.670% Debt-to-Total Capitalization -20.0% -10.0% 0.0% 10.0% 20.0% -1.0% 4.2% 3.9% 3.7% 3.4% 3.2% -0.5% 4.1% 3.9% 3.7% 3.5% 3.2% Pre-tax Cost of Debt 0.0% 4.0% 3.9% 3.7% 3.5% 3.3% 0.5% 4.0% 3.8% 3.7% 3.5% 3.4% 1.0% 3.9% 3.8% 3.7% 3.6% 3.5% Enterprise Value Cumulative Present Value of FCF $29,537.2 $202,362.3 332.3 Implied Equity Value and Share Price Enterprise Value Less: Total Debt Less: Preferred Stock Less: Noncontrolling Interest Plus: Cash and Cash Equivalents Implied Perpetuity Growth Rate Terminal Year Free Cash Flow (2026E) WACC Terminal Value $3,501.9 3.7% $206,952.8 2,775.3 Implied Perpetuity Growth Rate 1.9% Terminal Value Terminal Year EBITDA (2026E) Exit Multiple Terminal Value Discount Factor Present Value of Terminal Value % of Enterprise Value $5,168.6 40.0x $206,952.8 0.84 $172,825.1 85.4% Implied Equity Value $205,469.9 Implied EV/EBITDA Enterprise Value LTM 9/30/2021 EBITDA $202,362.3 11.919.6 Fully Diluted Shares Outstanding 244.4 Enterprise Value $202,362.3 Implied Share Price $840.71 Implied EV/EBITDA 17.0x 2.7% 3.2% 3.7% 4.2% 4.7% Enterprise Value Exit Multiple 39.5x 40.0x 204,681 204,681 209,270 209,270 209,270 $209,270 204,681 204,681 195,888 195,888 39.0x 206,946 211,591 211,591 206,946 198,046 WACC 40.5x 206,946 211,591 211,591 206,946 198,046 41.0x 211,477 216,233 216,233 211,477 202,362 Implied Perpetuity Growth Rate Exit Multiple 39.5x 40.0x 0.9% 0.9% 0.4% 0.4% 0.4% 0.4% 0.9% 0.9% 1.8% 1.8% 2.7% 3.2% 3.7% 4.2% 4.7% WACC 39.0x 0.9% 0.4% 0.4% 0.9% 1.9% 40.5x 0.9% 0.4% 0.4% 0.9% 1.9% 41.0x 0.9% 0.5% 0.5% 0.9% 1.9% Weighted Average Cost of Capital Analysis ($ in millions) WACC Calculation Target Capital Structure Debt-to-Total Capitalization Equity-to-Total Capitalization 0.75% 99.25% Comparable Companies Unlevered Beta Predicted Company Levered Beta Moderna 1.48 Regeneron 0.19 AstraZeneca 0.19 BioGen 0.44 Gilead Science 0.38 Market Value of Debt ($8,323.0) (9,833.0) 26,965.0 2,998.1 (7,829.0) Market Value of Equity $59,090.2 65,474.0 185,292.0 30,831.3 76,580.1 Debt Equity (14.1%) (15.0%) 14.6% 9.7% (10.2%) Marginal Tax Rate 8.8% 14.1% 19.6% 16.5% 20.2% Unlevered Beta 1.70 0.22 0.17 0.41 0.41 Cost of Debt Cost-of-Debt Tax Rate After-tax Cost of Debt 1.73% 31.0% 1.19% Mean Median 0.54 0.38 (3.0%) (10.2%) 0.58 0.41 ValueCo Relevered Beta Cost of Equity Risk-free Rate Market Risk Premium Levered Beta Cost of Equity 0.9% 4.7% 0.58 3.69% Mean Unlevered Beta 0.58 Target Debt/ Equity 0.8% Target Marginal Tax Rate 31.0% Relevered Beta 0.58 Relevered Beta WACC Sensitivity Analysis WACC 3.670% Debt-to-Total Capitalization -20.0% -10.0% 0.0% 10.0% 20.0% -1.0% 4.2% 3.9% 3.7% 3.4% 3.2% -0.5% 4.1% 3.9% 3.7% 3.5% 3.2% Pre-tax Cost of Debt 0.0% 4.0% 3.9% 3.7% 3.5% 3.3% 0.5% 4.0% 3.8% 3.7% 3.5% 3.4% 1.0% 3.9% 3.8% 3.7% 3.6% 3.5% Enterprise Value Cumulative Present Value of FCF $29,537.2 $202,362.3 332.3 Implied Equity Value and Share Price Enterprise Value Less: Total Debt Less: Preferred Stock Less: Noncontrolling Interest Plus: Cash and Cash Equivalents Implied Perpetuity Growth Rate Terminal Year Free Cash Flow (2026E) WACC Terminal Value $3,501.9 3.7% $206,952.8 2,775.3 Implied Perpetuity Growth Rate 1.9% Terminal Value Terminal Year EBITDA (2026E) Exit Multiple Terminal Value Discount Factor Present Value of Terminal Value % of Enterprise Value $5,168.6 40.0x $206,952.8 0.84 $172,825.1 85.4% Implied Equity Value $205,469.9 Implied EV/EBITDA Enterprise Value LTM 9/30/2021 EBITDA $202,362.3 11.919.6 Fully Diluted Shares Outstanding 244.4 Enterprise Value $202,362.3 Implied Share Price $840.71 Implied EV/EBITDA 17.0x 2.7% 3.2% 3.7% 4.2% 4.7% Enterprise Value Exit Multiple 39.5x 40.0x 204,681 204,681 209,270 209,270 209,270 $209,270 204,681 204,681 195,888 195,888 39.0x 206,946 211,591 211,591 206,946 198,046 WACC 40.5x 206,946 211,591 211,591 206,946 198,046 41.0x 211,477 216,233 216,233 211,477 202,362 Implied Perpetuity Growth Rate Exit Multiple 39.5x 40.0x 0.9% 0.9% 0.4% 0.4% 0.4% 0.4% 0.9% 0.9% 1.8% 1.8% 2.7% 3.2% 3.7% 4.2% 4.7% WACC 39.0x 0.9% 0.4% 0.4% 0.9% 1.9% 40.5x 0.9% 0.4% 0.4% 0.9% 1.9% 41.0x 0.9% 0.5% 0.5% 0.9% 1.9%
Step by Step Solution
There are 3 Steps involved in it

Get step-by-step solutions from verified subject matter experts