

Question: What is wrong with these 3 graphs? Opportunity (normalized) O- Hosts Vulns 120 90 60 30 0 Normalized (median, 2-year lag) MLOC Oulns Incidents 60
What is wrong with these 3 graphs?
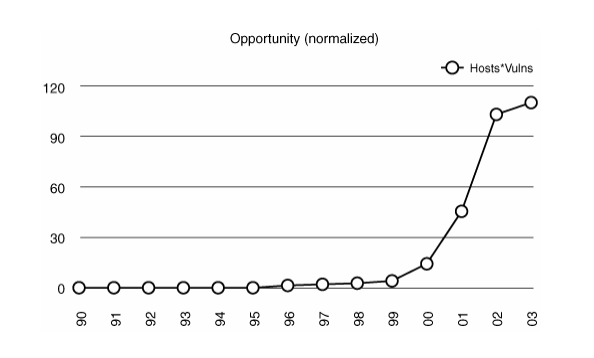
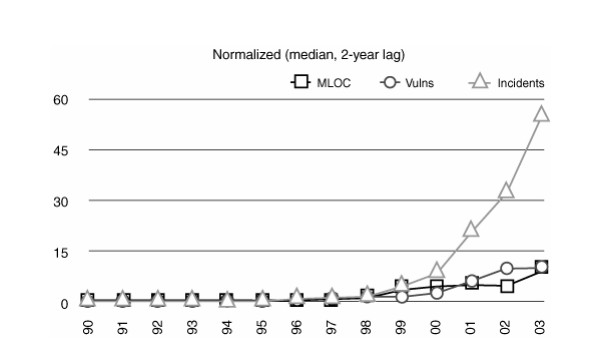
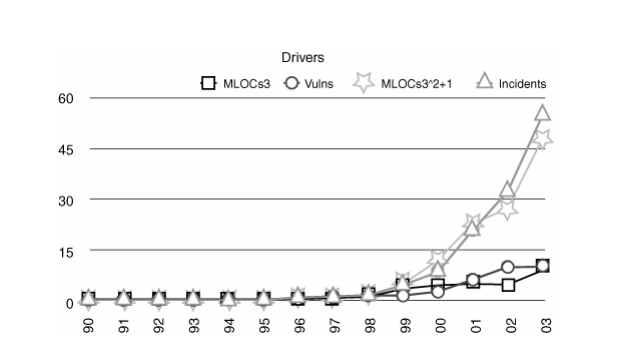
Opportunity (normalized) O- Hosts Vulns 120 90 60 30 0 Normalized (median, 2-year lag) MLOC Oulns Incidents 60 45 30 15 0 Drivers Vulns MLOCs3 2+1 60 45 30 15 0
Step by Step Solution
There are 3 Steps involved in it
1 Expert Approved Answer
Step: 1 Unlock

Question Has Been Solved by an Expert!
Get step-by-step solutions from verified subject matter experts
Step: 2 Unlock
Step: 3 Unlock