

Question: What is wrong with this graph I can not seem to figure it out. 1. Terry Schiavo was removed from life support after a years-long
What is wrong with this graph I can not seem to figure it out.
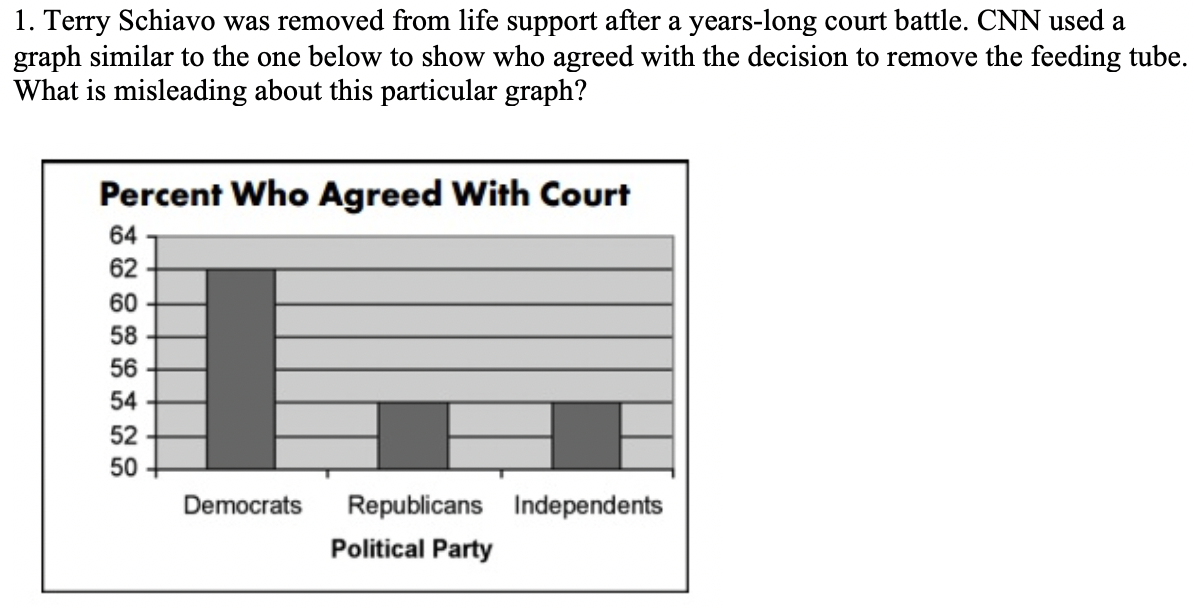
1. Terry Schiavo was removed from life support after a years-long court battle. CNN used a graph similar to the one below to show who agreed with the decision to remove the feeding tube. What is misleading about this particular graph? Percent Who Agreed With Court 64 62 60 58 56 54 52 50 Democrats Republicans Independents Political Party
Step by Step Solution
There are 3 Steps involved in it
1 Expert Approved Answer
Step: 1 Unlock

Question Has Been Solved by an Expert!
Get step-by-step solutions from verified subject matter experts
Step: 2 Unlock
Step: 3 Unlock