

Question: What patterns do you see in the frequency distributions and histogram ? is there any evidence, based on just two visualization, that tutoring is making
What patterns do you see in the frequency distributions and histogram ? is there any evidence, based on just two visualization, that tutoring is making a difference ? how did you know?
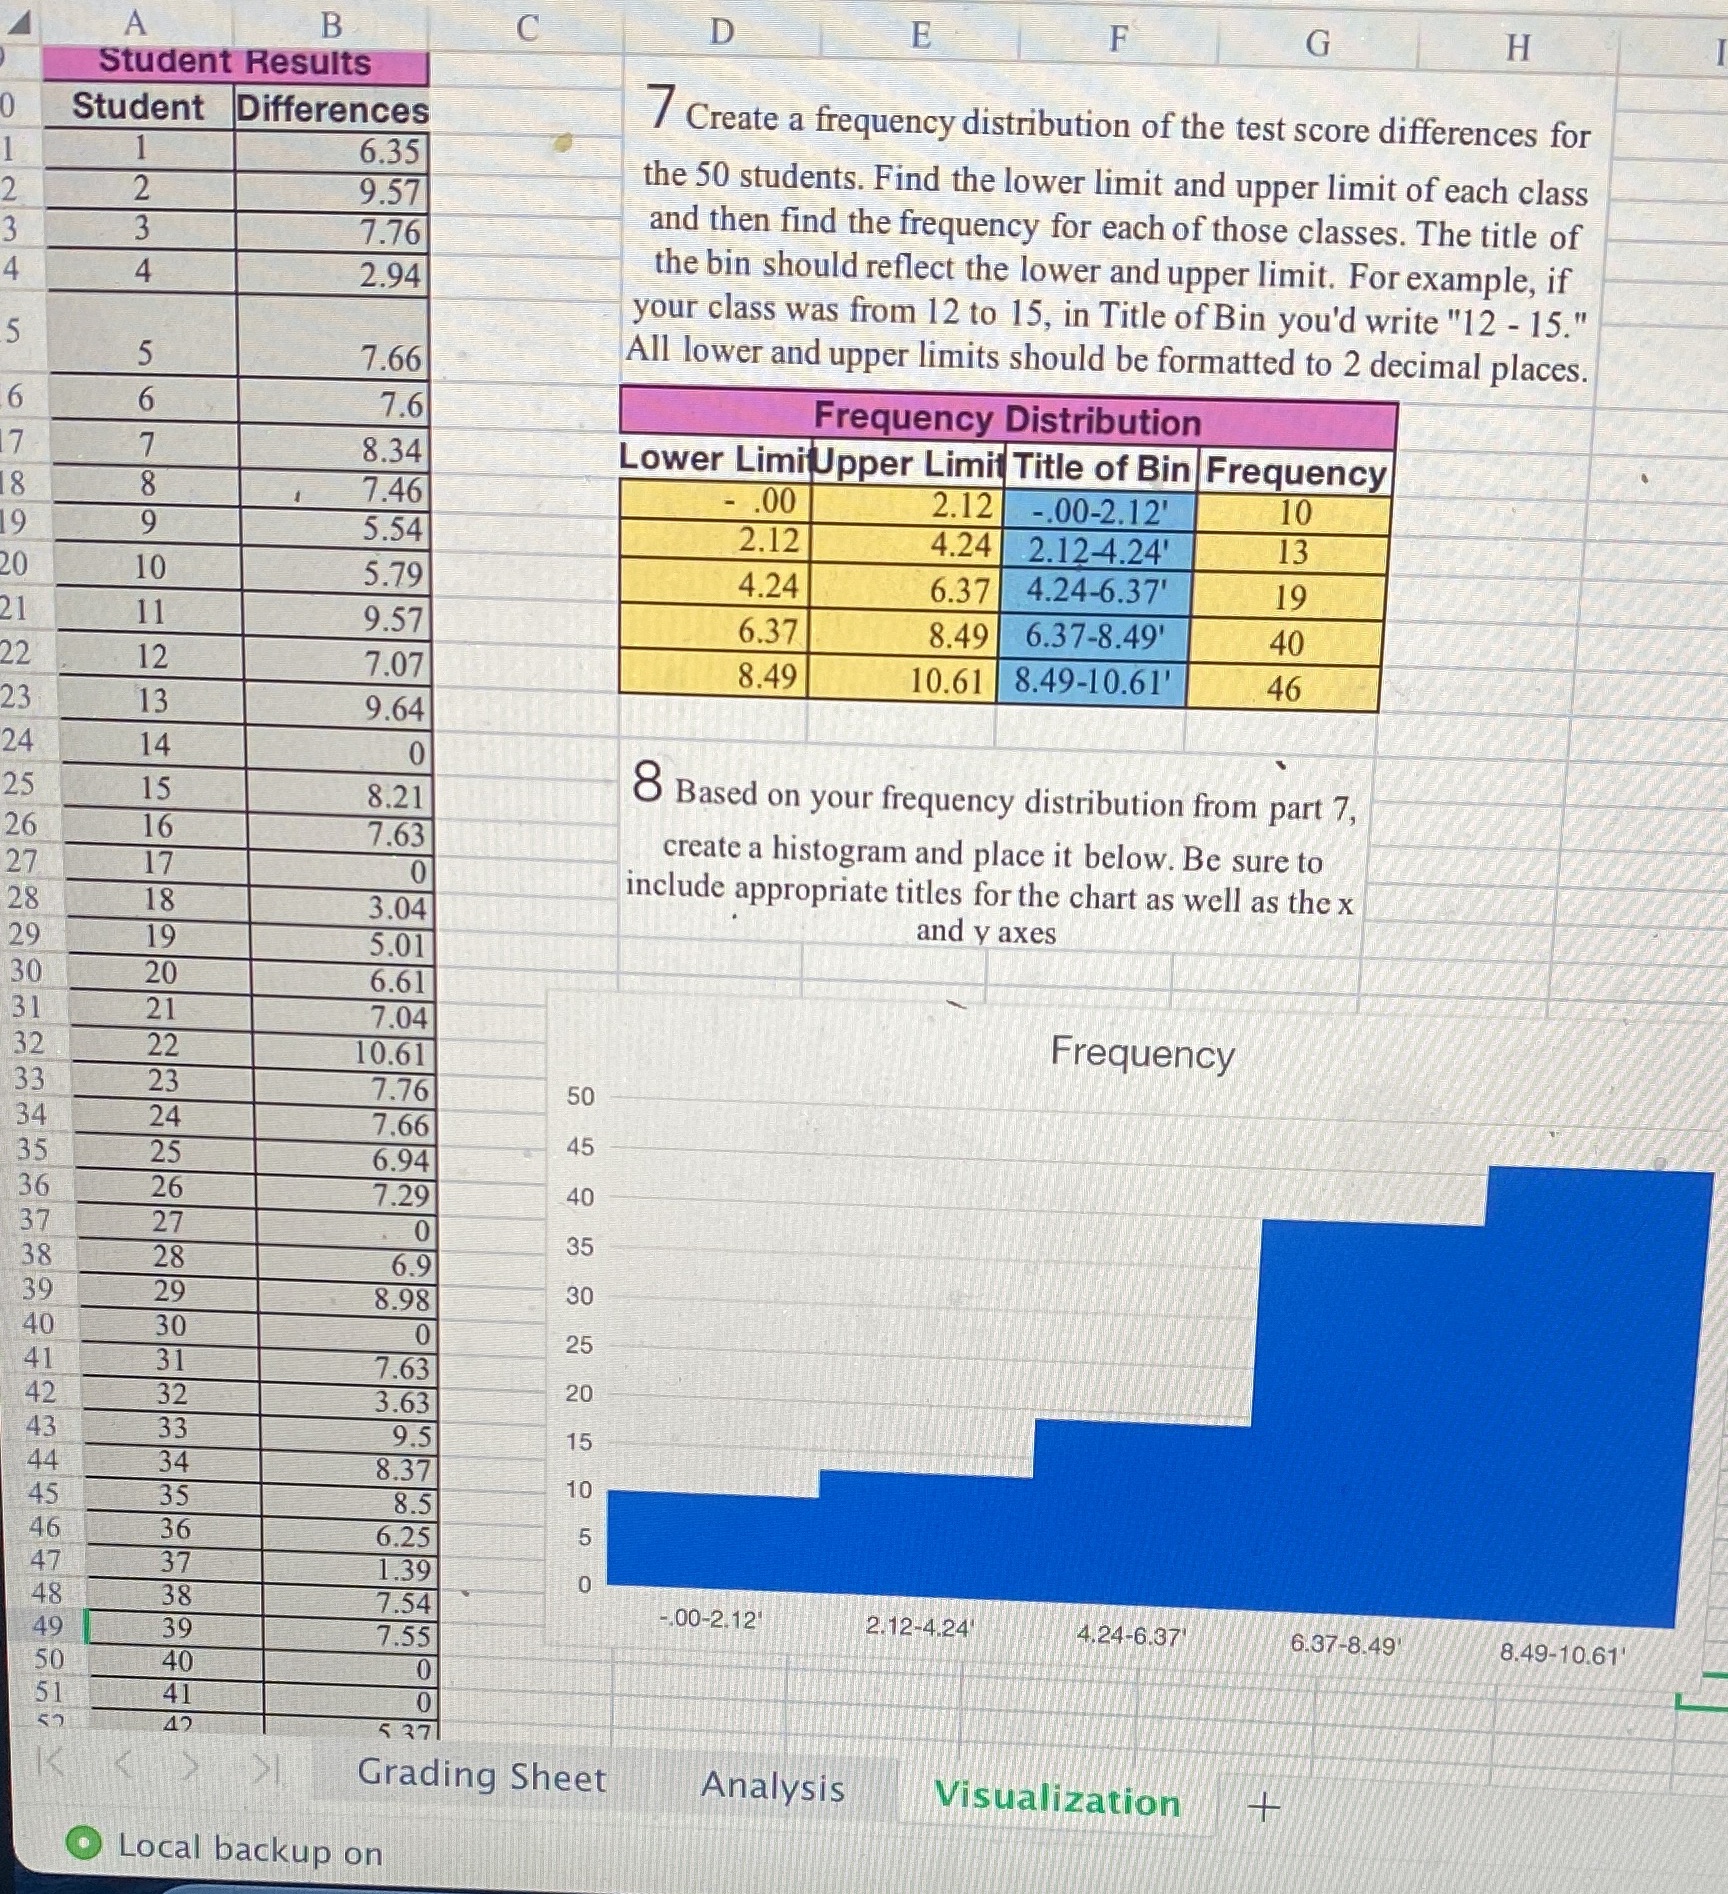
A B C D E F G H Student Results Student Differences 7 Create a frequency distribution of the test score differences for 6.35 9.57 the 50 students. Find the lower limit and upper limit of each class W N 7.76 and then find the frequency for each of those classes. The title of 4 2.94 the bin should reflect the lower and upper limit. For example, if your class was from 12 to 15, in Title of Bin you'd write "12 - 15." 7.66 All lower and upper limits should be formatted to 2 decimal places. 7.6 Frequency Distribution 8.34 Lower LimiUpper Limit Title of Bin Frequency 00 7.46 - .00 2.12 -.00-2.12' 10 9 5.54 2.12 4.24 2.12-4.24' 13 10 5.79 4.24 6.37 4.24-6.37' 19 11 9.57 6.37 8.49 6.37-8.49' 40 12 7.07 8.49 10.61 8.49-10.61' 46 13 9.64 14 0 15 8.21 8 Based on your frequency distribution from part 7, 26 16 7.63 17 create a histogram and place it below. Be sure to 0 18 include appropriate titles for the chart as well as the x 3.04 19 and y axes 5.01 20 6.61 7.04 Frequency 50 45 40 35 30 25 20 49 .00-2.12' 2.12-4.24 4.24-6.37 6.37-8.49 8.49-10.61' 50
Step by Step Solution
There are 3 Steps involved in it

Get step-by-step solutions from verified subject matter experts