

Question: What RStudio code to use please ? a) Produce a horizontal boxplot to illustrate the data. This should include suitable axes labels. b) Conduct a
What RStudio code to use please ?
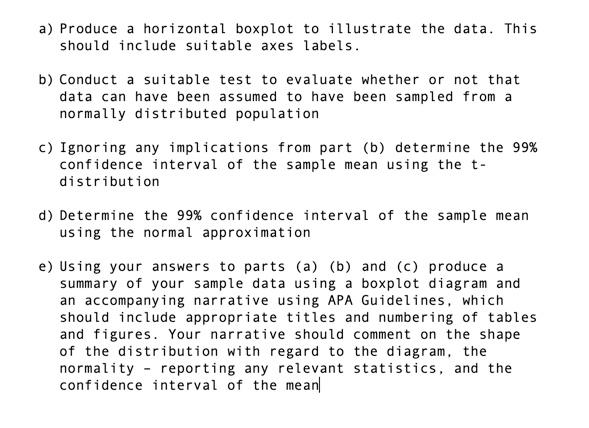
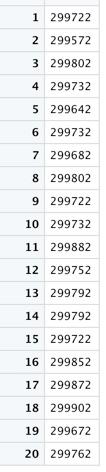
a) Produce a horizontal boxplot to illustrate the data. This should include suitable axes labels. b) Conduct a suitable test to evaluate whether or not that data can have been assumed to have been sampled from a normally distributed population c) Ignoring any implications from part (b) determine the 99% confidence interval of the sample mean using the t- distribution d) Determine the 99% confidence interval of the sample mean using the normal approximation e) Using your answers to parts (a) (b) and (c) produce a summary of your sample data using a boxplot diagram and an accompanying narrative using APA Guidelines, which should include appropriate titles and numbering of tables and figures. Your narrative should comment on the shape of the distribution with regard to the diagram. the normality - reporting any relevant statistics, and the confidence interval of the mean 1 299722 2299572 3299802 4 299732 5299642 6 299732 7299682 8 299802 9 299722 10 299732 11299882 12 299752 13299792 14 299792 15 299722 16 299852 17299872 18 299902 19 299672 20 299762 a) Produce a horizontal boxplot to illustrate the data. This should include suitable axes labels. b) Conduct a suitable test to evaluate whether or not that data can have been assumed to have been sampled from a normally distributed population c) Ignoring any implications from part (b) determine the 99% confidence interval of the sample mean using the t- distribution d) Determine the 99% confidence interval of the sample mean using the normal approximation e) Using your answers to parts (a) (b) and (c) produce a summary of your sample data using a boxplot diagram and an accompanying narrative using APA Guidelines, which should include appropriate titles and numbering of tables and figures. Your narrative should comment on the shape of the distribution with regard to the diagram. the normality - reporting any relevant statistics, and the confidence interval of the mean 1 299722 2299572 3299802 4 299732 5299642 6 299732 7299682 8 299802 9 299722 10 299732 11299882 12 299752 13299792 14 299792 15 299722 16 299852 17299872 18 299902 19 299672 20 299762
Step by Step Solution
There are 3 Steps involved in it

Get step-by-step solutions from verified subject matter experts