

Question: What sampling distribution will you use? Binomial, uniform, students t, normal or chi square?What are the degrees of freedom? ____C) estimate the p value of
What sampling distribution will you use? Binomial, uniform, students t, normal or chi square?What are the degrees of freedom? ____C) estimate the p value of the sample test statisticA) p value > 0.100B) 0.050

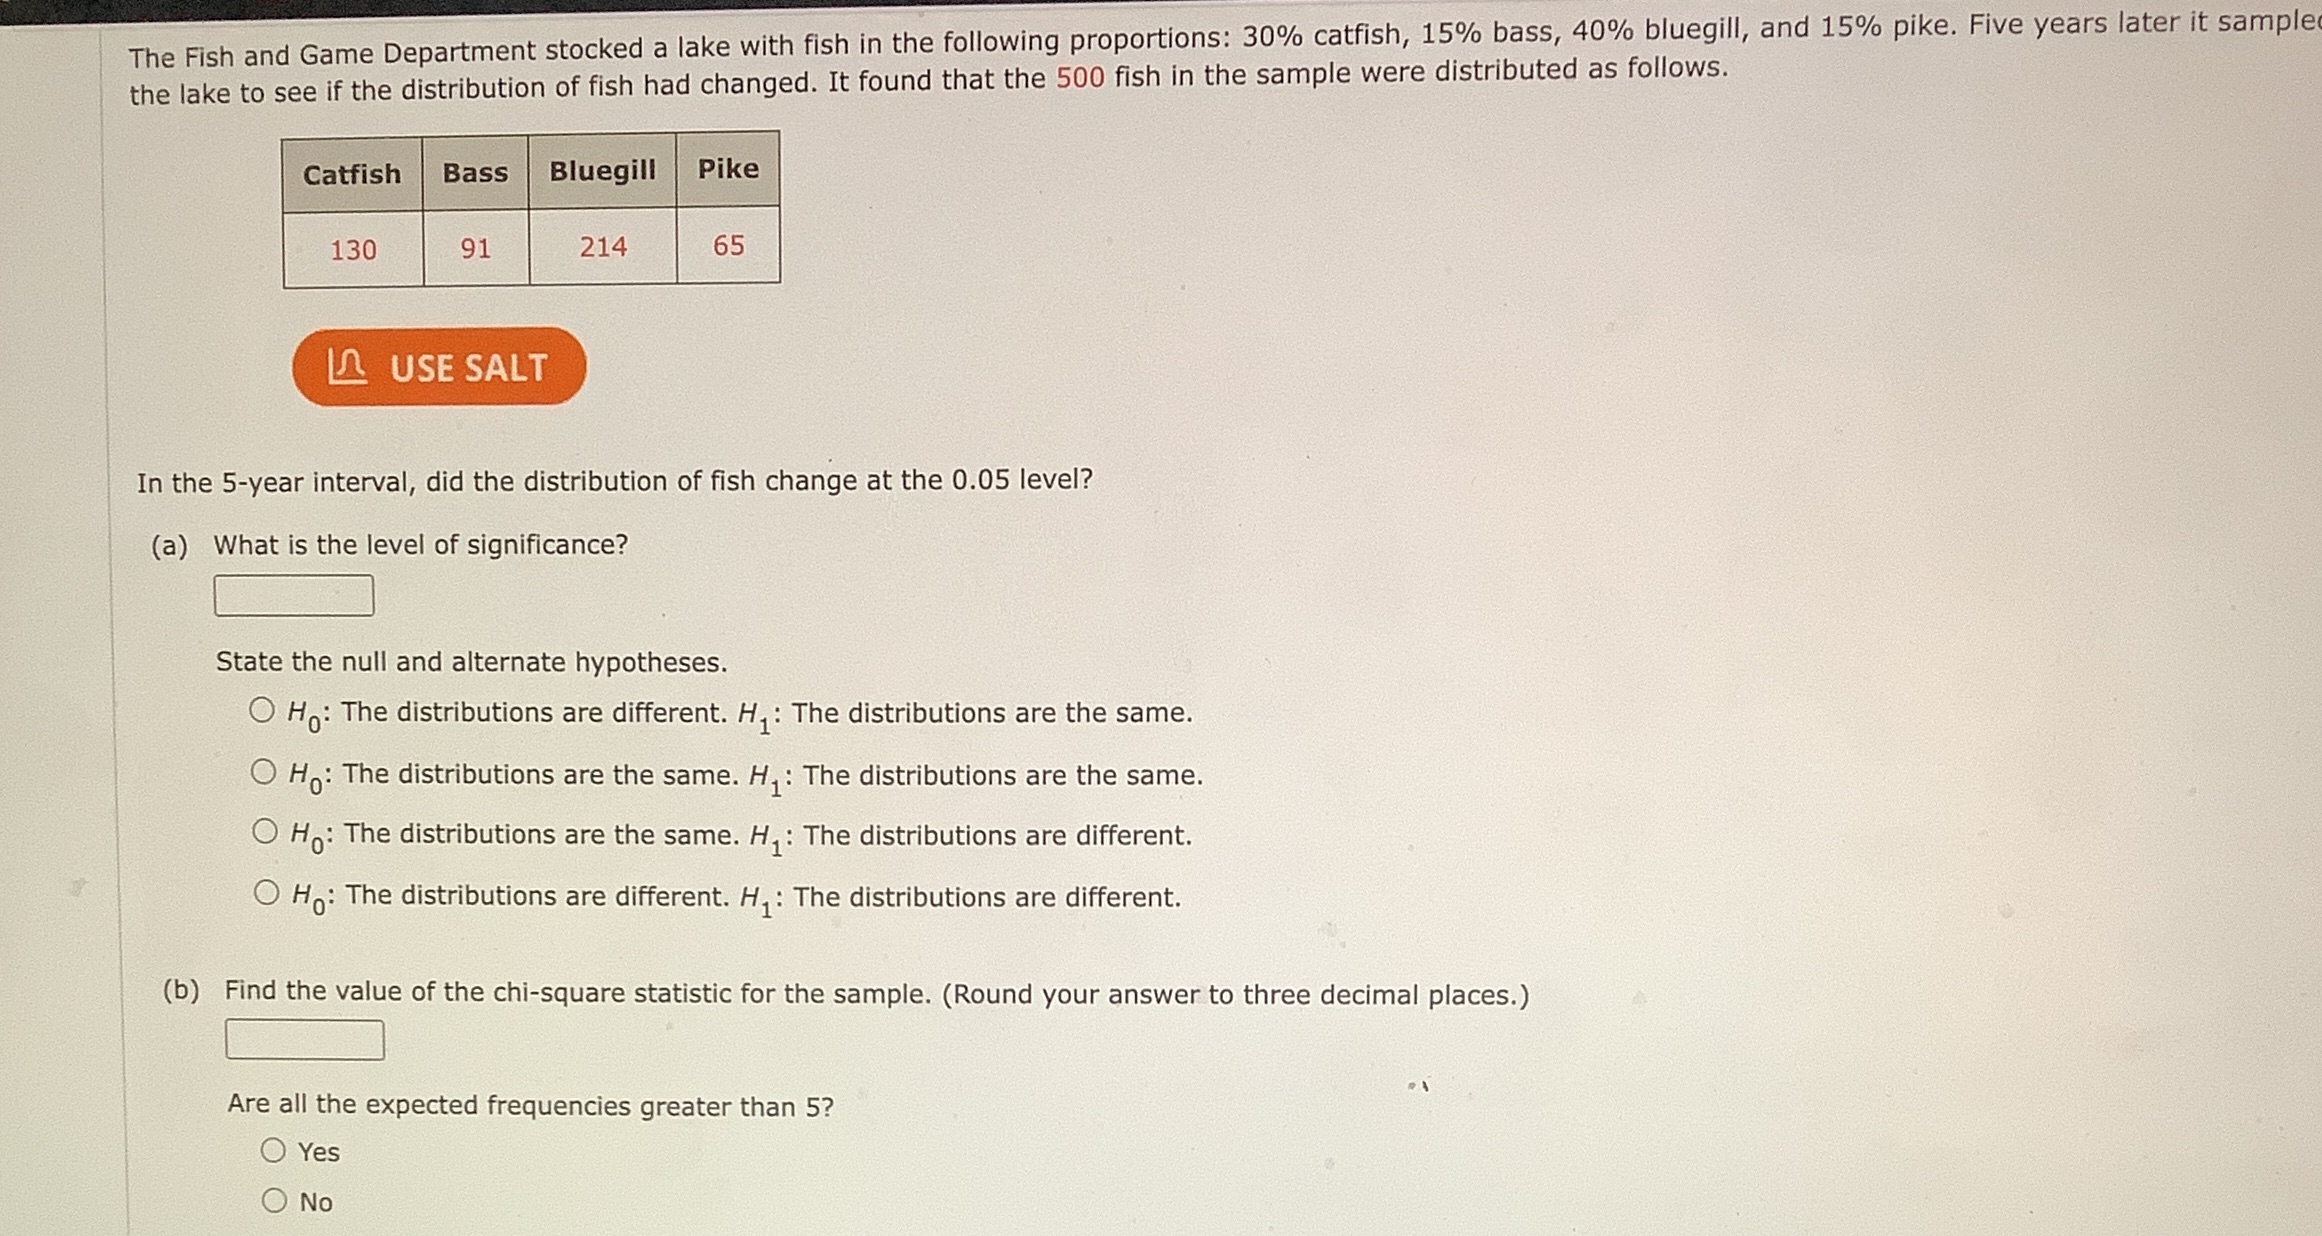
The Fish and Game Department stocked a lake with fish in the following proportions: 30% catfish, 15% bass, 40% bluegill, and 15% pike. Five years later it sample the lake to see if the distribution of fish had changed. It found that the 500 fish in the sample were distributed as follows. Catfish Bass Bluegill Pike 130 91 214 65 LA USE SALT In the 5-year interval, did the distribution of fish change at the 0.05 level? (a) What is the level of significance? State the null and alternate hypotheses. O H: The distributions are different. H, : The distributions are the same. O Ho: The distributions are the same. H, : The distributions are the same. O Ho: The distributions are the same. H, : The distributions are different. O Ho: The distributions are different. H : The distributions are different. (b) Find the value of the chi-square statistic for the sample. (Round your answer to three decimal places.) Are all the expected frequencies greater than 5? Yes O No
Step by Step Solution
There are 3 Steps involved in it

Get step-by-step solutions from verified subject matter experts