

Question: What is a bar graph? What is a Pareto chart? What is a bar graph? OA. A bar graph is a circular graph that
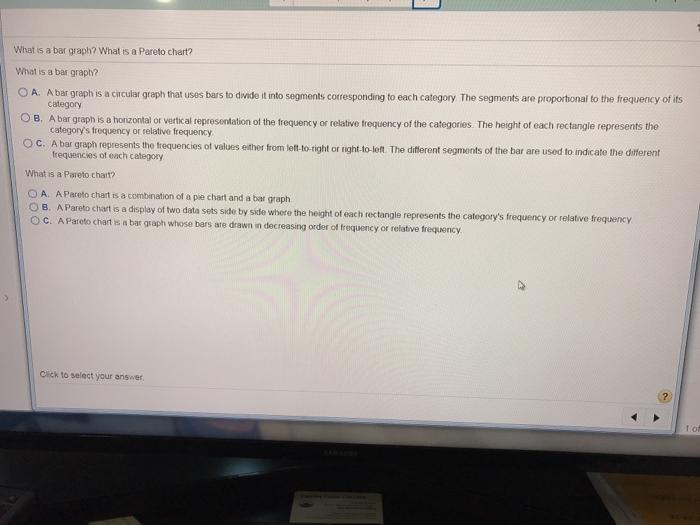
What is a bar graph? What is a Pareto chart? What is a bar graph? OA. A bar graph is a circular graph that uses bars to divide it into segments corresponding to each category. The segments are proportional to the frequency of its category OB. A bar graph is a horizontal or vertical representation of the frequency or relative frequency of the categories. The height of each rectangle represents the category's frequency or relative frequency OC. A bar graph represents the frequencies of values either from left-to-right or right-to-left. The different segments of the bar are used to indicate the different frequencies of each category What is a Pareto chart? OA. A Pareto chart is a combination of a pie chart and a bar graph OB. A Pareto chart is a display of two data sets side by side where the height of each rectangle represents the category's frequency or relative frequency OC. A Pareto chart is a bar graph whose bars are drawn in decreasing order of frequency or relative frequency. Click to select your answer. 1 of What is a bar graph? What is a Pareto chart? What is a bar graph? OA. A bar graph is a circular graph that uses bars to divide it into segments corresponding to each category. The segments are proportional to the frequency of its category OB. A bar graph is a horizontal or vertical representation of the frequency or relative frequency of the categories. The height of each rectangle represents the category's frequency or relative frequency OC. A bar graph represents the frequencies of values either from left-to-right or right-to-left. The different segments of the bar are used to indicate the different frequencies of each category What is a Pareto chart? OA. A Pareto chart is a combination of a pie chart and a bar graph OB. A Pareto chart is a display of two data sets side by side where the height of each rectangle represents the category's frequency or relative frequency OC. A Pareto chart is a bar graph whose bars are drawn in decreasing order of frequency or relative frequency. Click to select your answer. 1 of
Step by Step Solution
3.44 Rating (157 Votes )
There are 3 Steps involved in it
The detailed answer for the above question is provided below Answer Part1 A ... View full answer

Get step-by-step solutions from verified subject matter experts