

Question: What to submit? Please submit ( i ) a word file explaining in detail your answers to each question ( you can use screenshots of
What to submit?
Please submit i a word file explaining in detail your answers to each question you can use screenshots of the R to explain your answers AND ii an R file with a separate tab for each question. For each question, make sure you develop the model and present the simulation results the R file should be selfexplanatory. The
assessment of your work will include both the accuracy and the clarity of your word file and the R file.
GWS is a company that markets outboard motorboats directly to consumers for recreational use. Recently, they've been developing a project they think has a lot of potential: the first mass market boats with electric motors. They haven't started advertising their new product yet, nor have they organized a presale because they don't want to lose their firstmover advantage. As a result, GWS has a limited understanding of the size of the market for their new project. They plan to retail their
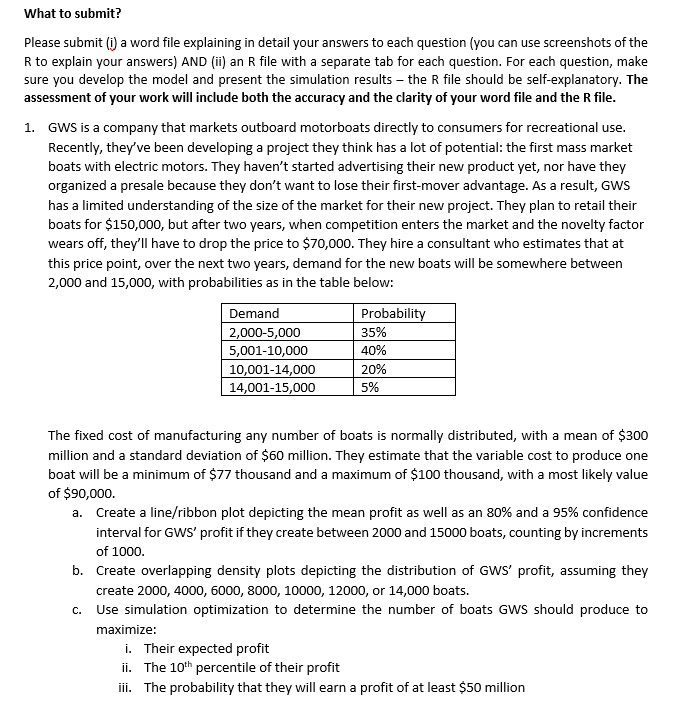
boats for $ but after two years, when competition enters the market and the novelty factor wears off, they'll have to drop the price to $ They hire a consultant who estimates that at this price point, over the next two years, demand for the new boats will be somewhere between and with probabilities as in the table below:
The fixed cost of manufacturing any number of boats is normally distributed, with a mean of $ million and a standard deviation of $ million. They estimate that the variable cost to produce one boat will be a minimum of $ thousand and a maximum of $ thousand, with a most likely value of $
a Create a lineribbon plot depicting the mean profit as well as an and a confidence interval for GWS profit if they create between and boats, counting by increments of
b Create overlapping density plots depicting the distribution of GWS profit, assuming they create or boats.
c Use simulation optimization to determine the number of boats GWS should produce to maximize:
i Their expected profit
ii The th percentile of their profit
iii. The probability that they will earn a profit of at least $ million
Step by Step Solution
There are 3 Steps involved in it
1 Expert Approved Answer
Step: 1 Unlock

Question Has Been Solved by an Expert!
Get step-by-step solutions from verified subject matter experts
Step: 2 Unlock
Step: 3 Unlock