

Question: What type of function does the table represent? X V -7 128 -6 64 -5 32 -4 16 -3 8 O Exponential O Linear None
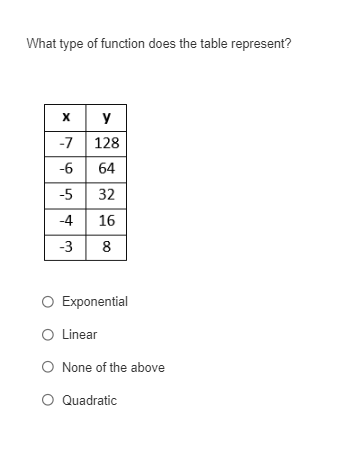
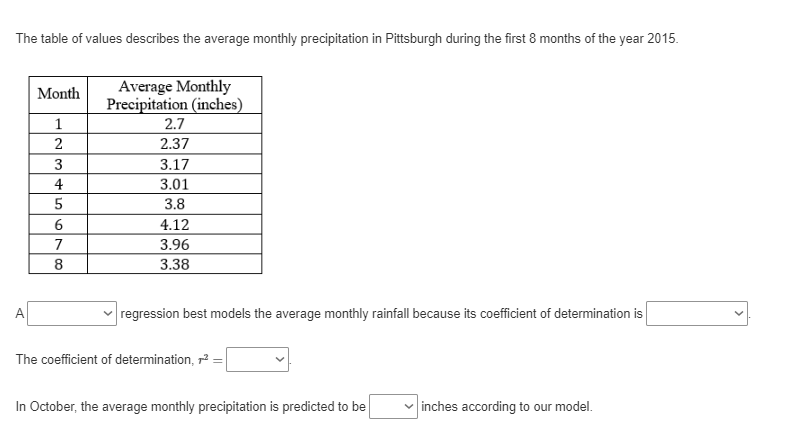
What type of function does the table represent? X V -7 128 -6 64 -5 32 -4 16 -3 8 O Exponential O Linear None of the above O QuadraticThe table of values describes the average monthly precipitation in Pittsburgh during the first 8 months of the year 2015. Month Average Monthly Precipitation (inches) 2.7 2 2.37 3.17 3.01 3.8 4.12 3.96 8 3.38 A regression best models the average monthly rainfall because its coefficient of determination is The coefficient of determination, 1 = In October, the average monthly precipitation is predicted to be inches according to our model
Step by Step Solution
There are 3 Steps involved in it
1 Expert Approved Answer
Step: 1 Unlock

Question Has Been Solved by an Expert!
Get step-by-step solutions from verified subject matter experts
Step: 2 Unlock
Step: 3 Unlock