

Question: What will the chart and graph look finished and can I have an explanation please? Thank you Total Product Total Cost Marginal Cost Total Fixed
What will the chart and graph look finished and can I have an explanation please? Thank you
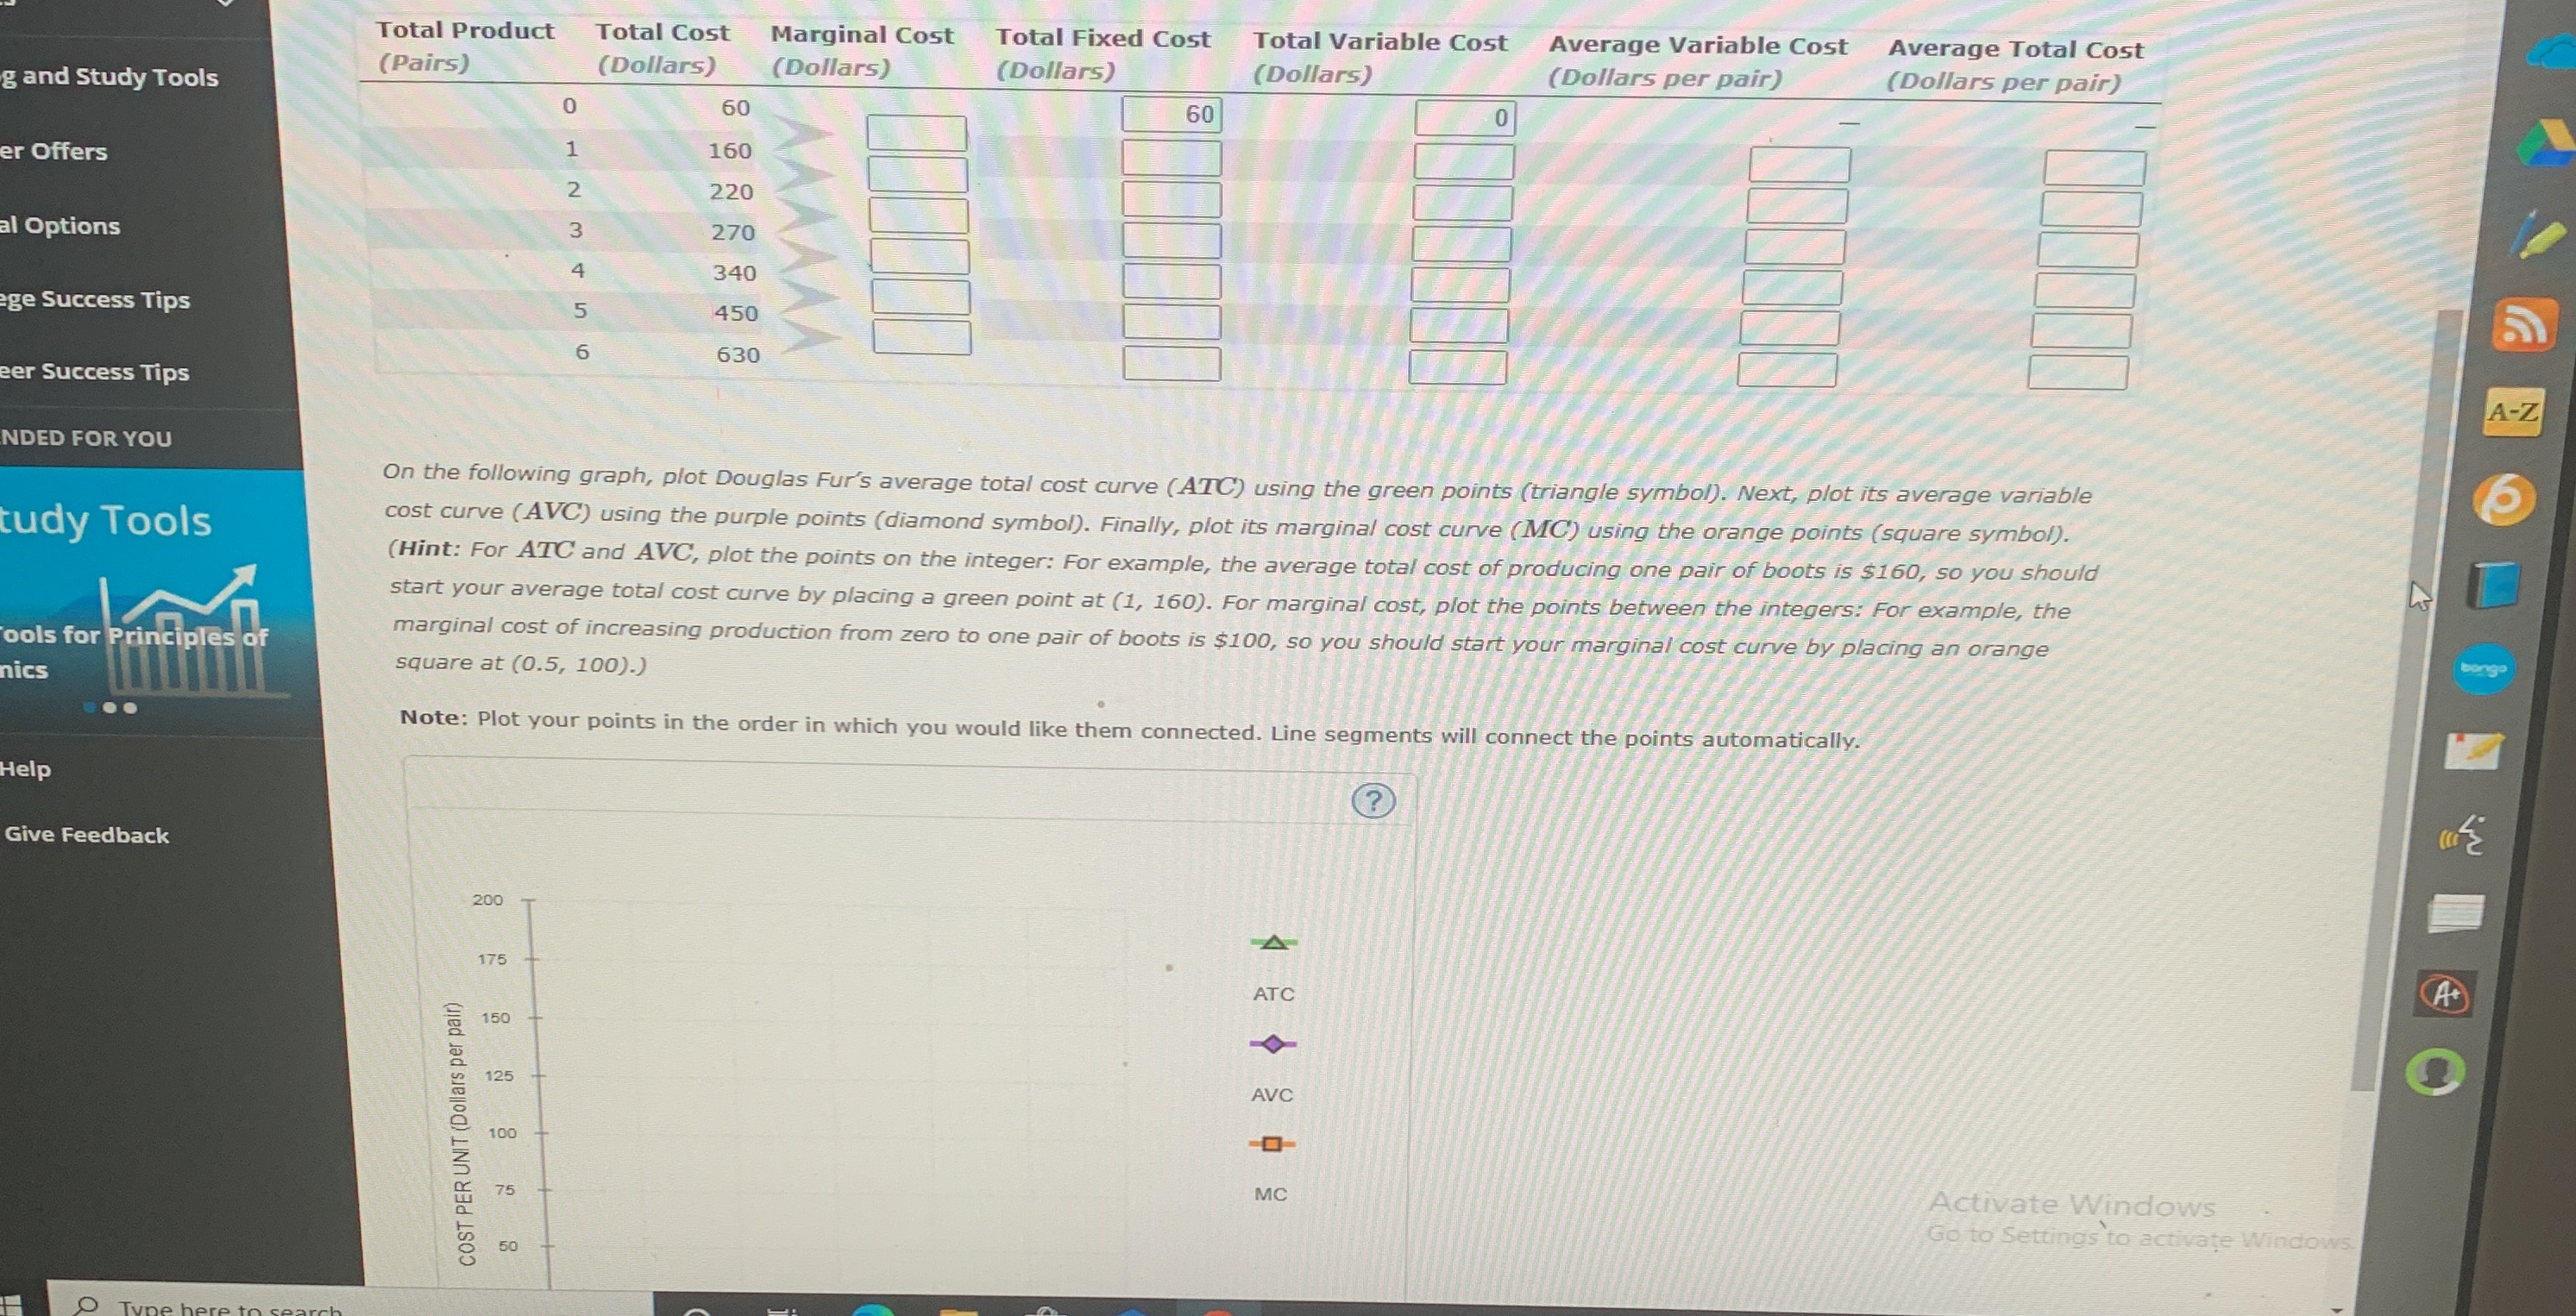
Total Product Total Cost Marginal Cost Total Fixed Cost Total Variable Cost Average Variable Cost Average Total Cost g and Study Tools (Pairs) (Dollars) (Dollars) (Dollars) (Dollars) (Dollars per pair) (Dollars per pair) 0 60 60 er Offers 160 220 al Options W N 270 340 ge Success Tips OUT A 450 630 eer Success Tips A-Z NDED FOR YOU On the following graph, plot Douglas Fur's average total cost curve (ATC) using the green points (triangle symbol). Next, plot its average variable tudy Tools cost curve (AVC) using the purple points (diamond symbol). Finally, plot its marginal cost curve (MC) using the orange points (square symbol). (Hint: For ATC and AVC, plot the points on the integer: For example, the average total cost of producing one pair of boots is $160, so you should start your average total cost curve by placing a green point at (1, 160). For marginal cost, plot the points between the integers: For example, the ools for Principles of marginal cost of increasing production from zero to one pair of boots is $100, so you should start your marginal cost curve by placing an orange nics square at (0.5, 100).) bangs .. Note: Plot your points in the order in which you would like them connected. Line segments will connect the points automatically. Help Give Feedback 200 175 ATC COST PER UNIT (Dollars per pair) 150 125 AVC 100 75 MC Activate Windows Go to Settings to activate Windows 50
Step by Step Solution
There are 3 Steps involved in it

Get step-by-step solutions from verified subject matter experts