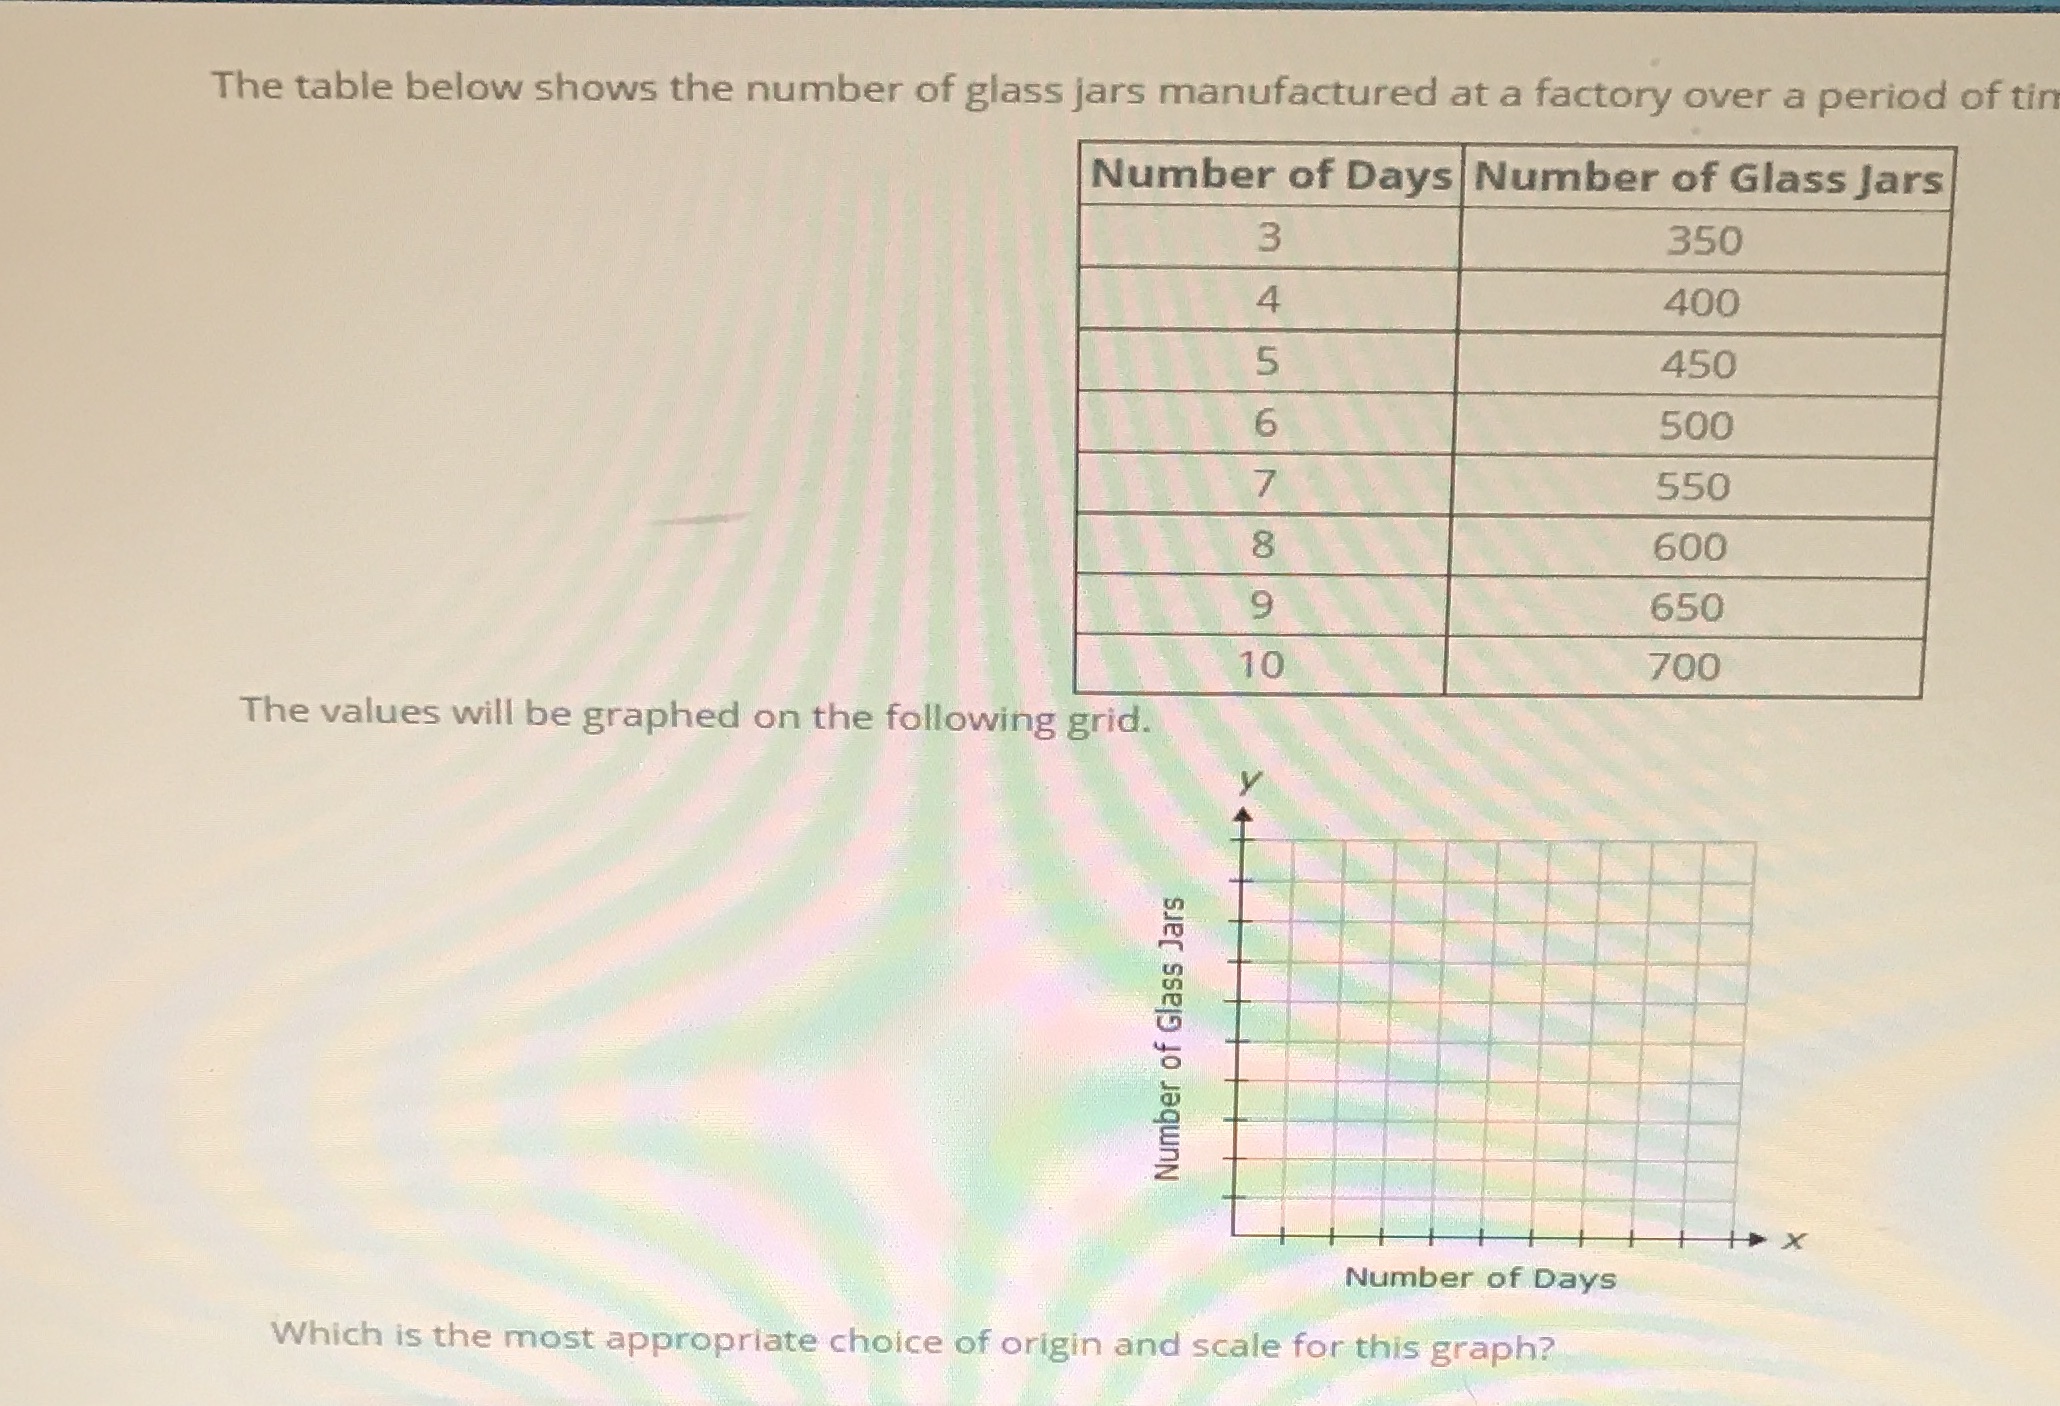
Question: What would be an appropriate origin and scale for this graph The table below shows the number of glass jars manufactured at a factory over

What would be an appropriate origin and scale for this graph

What would be an appropriate origin and scale for
The table below shows the number of glass jars manufactured at a factory over a period of tin Number of Days Number of Glass Jars 3 350 4 400 5 450 6 500 7 550 8 600 9 650 10 700 The values will be graphed on the following grid. Number of Glass Jars X Number of Days Which is the most appropriate choice of origin and scale for this graph

Step by Step Solution

There are 3 Steps involved in it

1 Expert Approved Answer
Step: 1 Unlock blur-text-image
Question Has Been Solved by an Expert!

Get step-by-step solutions from verified subject matter experts

Step: 2 Unlock
Step: 3 Unlock

Students Have Also Explored These Related Mathematics Questions!