

Question: What would be the analysis for this output when completing a binary logistic regression analyst with multiple variables? Case Processing Summary Unweighted Cases N Percent
What would be the analysis for this output when completing a binary logistic regression analyst with multiple variables?
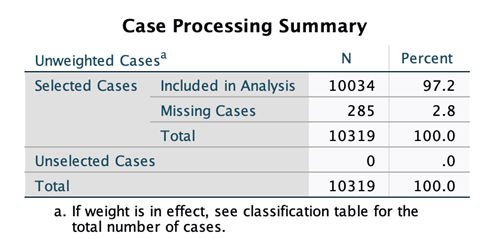
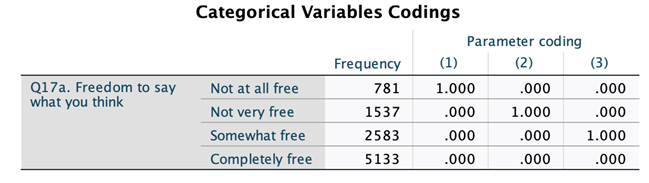
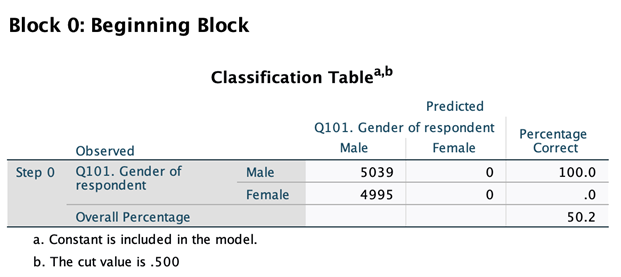
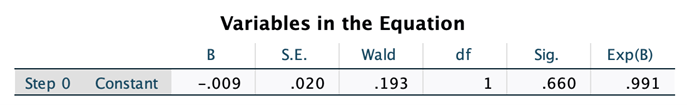
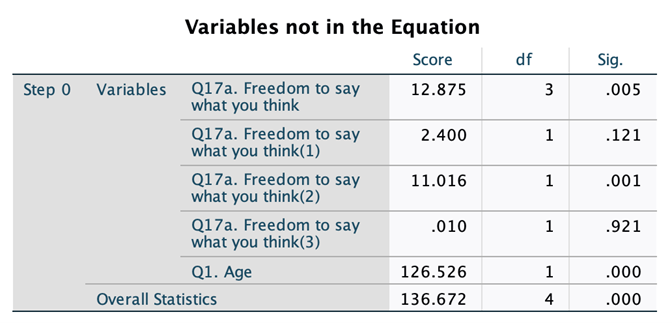
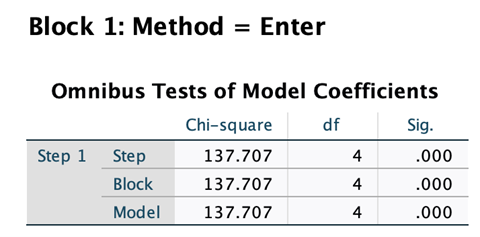
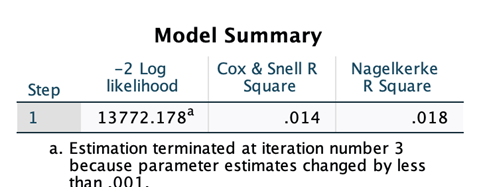
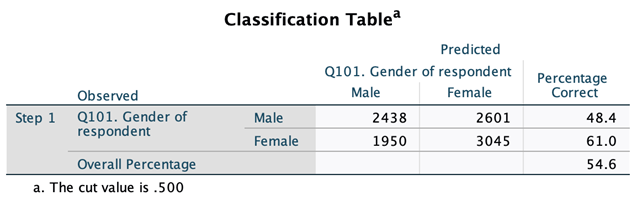
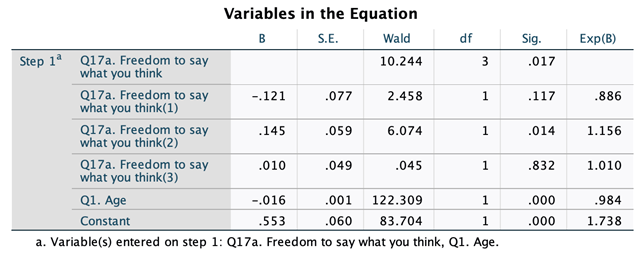
Case Processing Summary Unweighted Cases N Percent Selected Cases Included in Analysis 10034 97.2 Missing Cases 285 2.8 Total 10319 100.0 Unselected Cases 0 .0 Total 10319 100.0 a. If weight is in effect, see classification table for the total number of cases.Categorical Variables Codings Parameter coding Frequency (1) (2) (3) Q17a. Freedom to say Not at all free 781 1.000 .000 000 what you think Not very free 1537 .000 1.000 .000 Somewhat free 2583 000 .000 1.000 Completely free 5133 .000 .000 .000Block 0: Beginning Block Classification Tableab Predicted Q101. Gender of respondent Percentage Observed Male Female Correct Step 0 Q101. Gender of Male 5039 0 100.0 respondent Female 4995 0 .0 Overall Percentage 50.2 a. Constant is included in the model. b. The cut value is .500\f\fBlock 1: Method = Enter Omnibus Tests of Model Coefficients Chi-square df Sig. Step 1 Step 137.707 .000 Block 137.707 .000 Model 137.707 .000Model Summary 2 Log Cox 8: Snell R Nagelkerke Step likelihood Square R Square 1 13772.1?8a .014 .018 :1. Estimation terminated at iteration number 3 because parameter estimates changed by less than .001. Classification Table Predicted Q101. Gender of respondent Percentage Observed Male Female Correct Step 1 Q101. Gender of Male 2438 2601 48.4 respondent Female 1950 3045 61.0 Overall Percentage 54.6 a. The cut value is .500Variables in the Equation B S.E. Wald df Sig. Exp(B) Step 1" Q17a. Freedom to say 10.244 017 what you think Q17a. Freedom to say -.121 077 2.458 .117 .886 what you think(1) Q17a. Freedom to say .145 .059 6.074 .014 1.156 what you think(2) Q17a. Freedom to say .010 .049 .045 .832 1.010 what you think(3) Q1. Age -.016 001 122.309 1 .000 .984 Constant .553 .060 83.704 .000 1.738 a. Variable(s) entered on step 1: Q17a. Freedom to say what you think, Q1. Age
Step by Step Solution
There are 3 Steps involved in it

Get step-by-step solutions from verified subject matter experts