

Question: What would the Excel formula be to solve what I circled in red? I need a formula that displays the title of the movie to
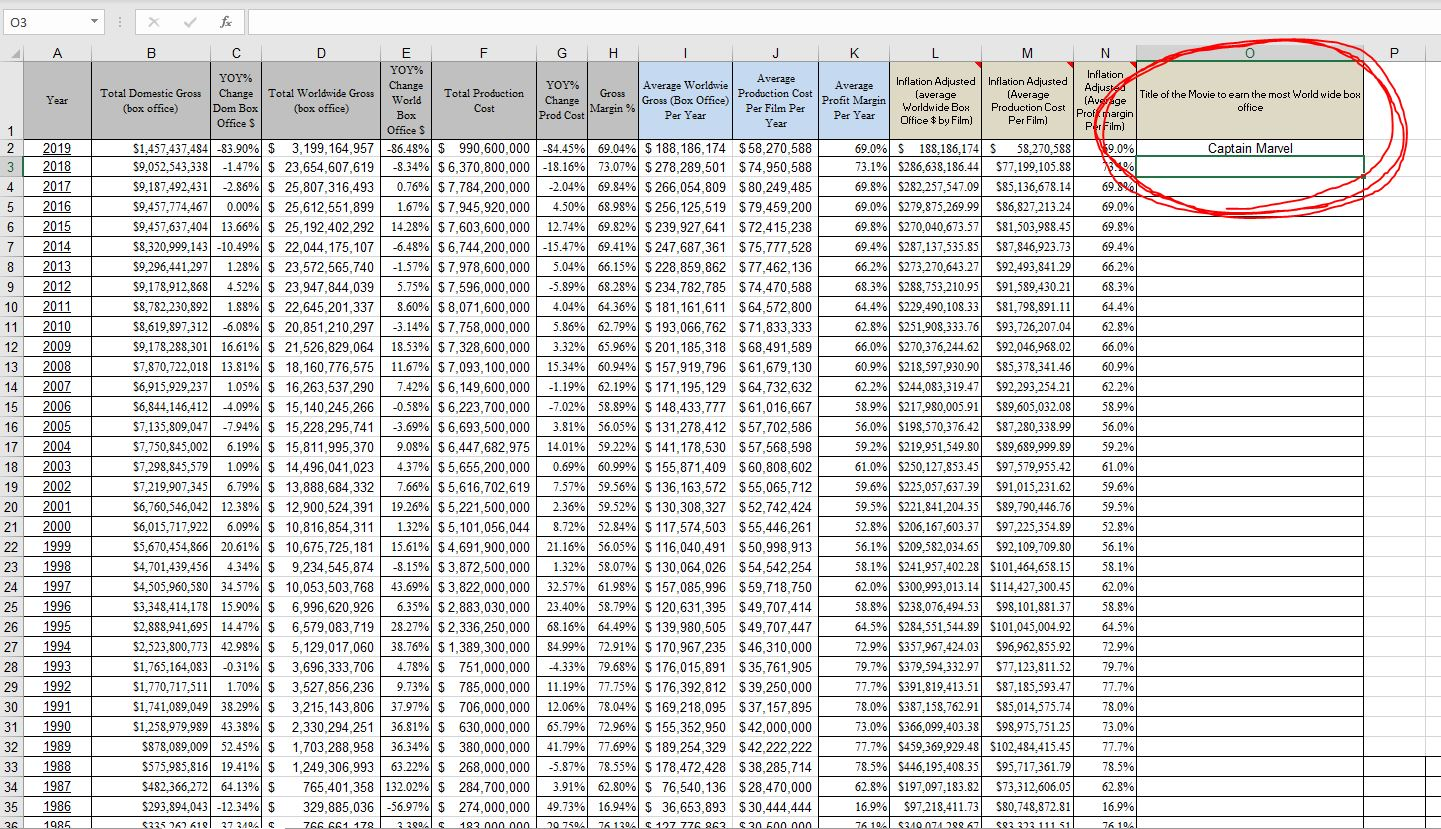
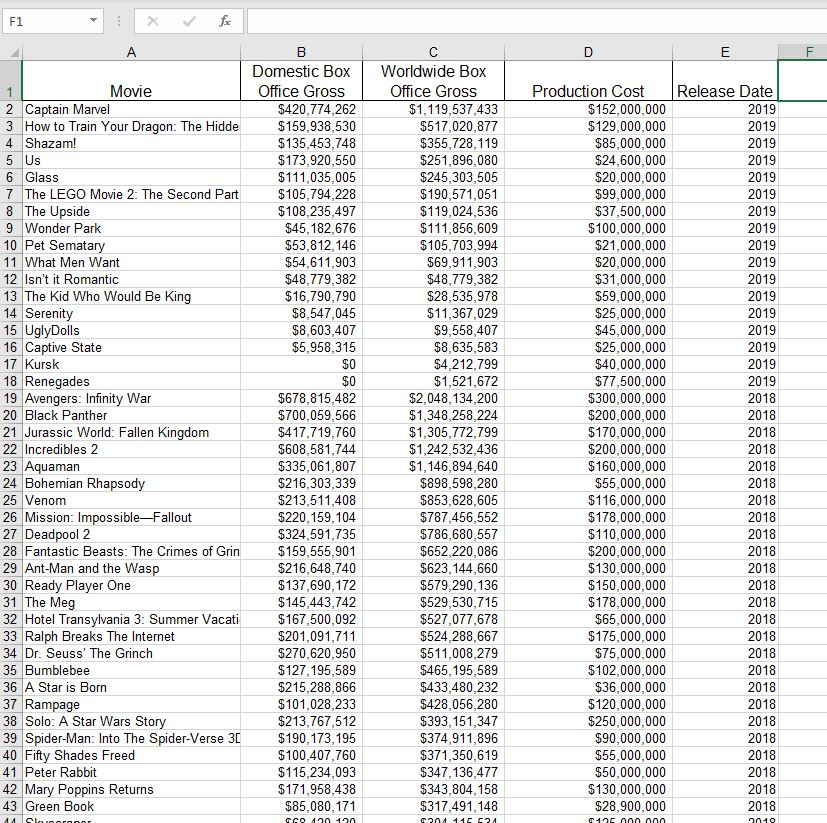
What would the Excel formula be to solve what I circled in red? I need a formula that displays the title of the movie to earn the biggest world-wide box office per year. As you can see in the second picture, there are many movies per year, but I'm having trouble finding a formula that finds the best performing movie world-wide by box office for each year. I don't think there is a way I can attach the Excel file, so hopefully these screenshots are enough
03 > - 0 Year Title of the Movie to earn the most World wide box office 1 2 Captain Marvel 4 5 6 7 8 9 10 11 12 13 14 15 16 B D E F G H J YOY% YOY% Change YOY% Average Average Worlds Total Domestic Gross Change Total Worldwide Gross Total Production Gross Production Cost World Change Gross (Box Office) (box office) Dom Box (box office) Cost Margin% Per Film Per Box Prod Cost Per Year Offices Year Offices $1,457,437,484 -83.90% $ 3,199,164,957-86.48% $ 990,600,000 -84.45% 69.04% $ 188,186,174 $58,270,588 $9.052.543.338 -1.47% $ 23,654,607,619 -8.34% $ 6,370,800,000 -18.16% 73.07% $ 278,289,501 $ 74,950,588 $9,187,492,431 -2.86% $ 25,807,316,493 0.76% $ 7,784,200,000 -2.04% 69.84% $ 266,054,809 $ 80,249,485 $9,457,774,467 0.00% $ 25,612,551,899 1.67% $ 7,945,920,000 4.50% 68.98% $ 256,125,519 $ 79,459,200 $9.457,637,404 13.66% $ 25,192,402,292 14.28% $ 7,603,600,000 12.74% 69.82% $ 239,927,641 $ 72,415,238 $8.320,999,143 -10.49% $ 22,044, 175, 107 -6.48% $ 6,744,200,000 -15.47% 69.41% $ 247,687,361 $ 75,777,528 $9,296,441,297 1.28% $ 23,572,565,740 -1.57% $ 7,978,600,000 5.04% 66.15% $ 228,859,862 $77,462, 136 $9,178.912.868 4.52% $ 23,947,844,039 5.75% $ 7,596,000,000 -5.89% 68.28% $ 234,782,785 $ 74,470,588 $8,782,230,892 1.88% $ 22,645,201,337 8.60% $ 8,071,600,000 4.04% 64.36% $ 181,161,611 $ 64,572,800 58,619,897,312 -6.08% $ 20,851,210,297 -3.14% $ 7,758,000,000 5.86% 62.79% $ 193,066,762 $71,833,333 $9,178,288,301 16.61% $ 21,526,829,064 18.53% $ 7,328,600,000 3.32% 65.96% $ 201,185,318 $68,491,589 $7,870,722,018 13.81% $ 18,160,776,575 11.67$7,093,100,000 15.34% 60.94% $ 157,919,796 $61,679,130 $6,915,929,237 1.05% $ 16,263,537,290 7.42% $ 6,149,600,000 -1.19% 62.19% $ 171,195,129 $ 64,732,632 56,844.146.412 4.09% $ 15,140,245,266 -0.58% $ 6,223,700,000 -7.02% 58.89% $ 148,433,777 $61,016,667 57,135,809,047 -7.94% $ 15,228,295,741 -3.69% $ 6,693,500,000 3.81% 56.05% $ 131,278,412 $ 57,702,586 $7,750,845,002 6.19% $ 15,811,995,370 9.08% $6,447,682,975 14.01% 59.22% $ 141,178,530 $57,568,598 $7,298,845,579 1.09% $ 14,496,041,023 4.37% $ 5,655,200,000 0.69% 60.99% $ 155,871,409 $60,808,602 $7,219,907,345 6.79% $ 13,888,684,332 7.66% $ 5,616,702,619 7.57% 59.56% $ 136,163,572 $55,065,712 $6,760,546,042 12.38% $ 12,900,524,391 19.26% $ 5,221,500,000 2.36% 59.52% $ 130,308,327 $52,742,424 $6,015,717,922 6.09% $ 10,816,854,311 1.32% $ 5,101,056,044 8.72% 52.84% $ 117,574,503 $ 55,446,261 $5,670,454,866 20.61% $ 10,675,725,181 15.61% $4,691,900,000 21.16% 56.05% $ 116,040,491 $50,998,913 $4,701,439,456 4.34% $ 9,234,545,874 -8.15% $ 3,872,500,000 1.32% 58.07% $ 130,064,026 $ 54,542,254 $4,505,960,580 34.57% $ 10,053,503,768 43.69% $ 3,822,000,000 32.57% 61.98% $ 157,085,996 $59,718,750 $3,348,414,178 15.90% $ 6,996,620,926 6.35% $ 2,883,030,000 23.40% 58.79% $ 120,631,395 $49,707,414 $2.888.941,695 14.47% $ 6,579,083,719 28.27% $2,336,250,000 68.16% 64.49% $ 139,980,505 $49,707,447 $2,523,800,773 42.98% $ 5,129,017,060 38.76% $ 1,389,300,000 84.99% 72.91% $ 170.967,235 $46,310,000 $1,765,164,083 -0.31% $ 3,696,333,706 4.78% $ 751,000,000 4.33% 79.68% $ 176,015,891 $35,761,905 $1,770,717,5111.70% $ 3,527,856,236 9.73% $ 785,000,000 11.19% 77.75% $ 176,392,812 $ 39,250,000 $1,741,089,049 38.29% $ 3,215, 143,806 37.97% $ 706,000,000 12.06% 78.04$ 169,218,095 $37,157,895 $1,258,979,989 43.38%$ 2,330,294,251 36.81% $ 630,000,000 65.79% 72.96% $ 155,352,950 $42,000,000 5878,089,009 52.45% $ 1,703,288,958 36.34% $ 380,000,000 41.79% 77.69% $ 189,254,329 $42,222,222 $575,985,816 19.41% $ 1,249,306,993 63.22% $ 268,000,000 -5.87% 78.55% $ 178,472,428 $38,285,714 $482,366,272 64.13% $ 765,401,358 132.02% $ 284,700,000 3.91% 62.80% $ 76,540,136 $28,470,000 $293.894,043 -12.34% $ 329,885,036 -56.97% $ 274,000,000 49.73% 16.94% $ 36,653,893 $ 30,444,444 3.300.1 c K L M N Inflation Average Inflation Adjusted Inflation Adjusted Adjusted Profit Margin (average (Average (Average Worldwide Box Production Cost Per Year Office $by Film) Prof targin Per Film) Per Film) 69.0% S188.186.174 S 58.270.588 9.0% 73.1% $286.638.186.44 $77,199,105.88 12 69.8% $282,257,547.09 $85,136,678.14 69.896 69.0% $279,875,269.99 $86,827,213.24 69.0% 69.8% $270,040,673.57 $81,503,988.45 69.8% 69.4% $287,137,535.85 $87,846,923.73 69.4% 66.2% $273.270,643.27 $92,493,841.29 66.2% 68.3% $288,753,210.95 $91,589,430.21 68.3% 64.4% $229,490,108.33 $81,798,891.11 64.4% 62.8% $251,908,333.76 $93,726,207.04 62.8% 66.0% $270,376,244.62 $92,046,968.02 66.0% 60.9% $218,597,930.90 585,378,341.46 60.99 62.2% $244.083,319.47 $92,293,254.21 62.2% 58.9% $217,980,005.91 $89,605,032.08 58.9% 56.0% $198,570,376.42 $87,280,338.99 56.0% 59.2% $219,951,549.80 $89,689,999.89 59.2% 61.0% $250,127,853.45 $97,579,955.42 61.0% 59.6% $225,057,637.39 $91,015,231.62 59.6% 59.5% $221.841.204.35 $89,790,446.76 59.5% 52.8% $206.167.603.37 $97.225,354.89 52.8% 56.1% $209,582,034.65 $92,109,709.80 56.1% 58.1% $241,957,402.28 $101,464,658.15 58.1% 62.0% $300,993,013.14 $114,427,300.45 62.0% 58.8% $238,076,494.53 598,101,881.37 58.8% 64.5% $284.551.544.89 $101,045,004.92 64.5% 72.9% $357,967,424.03 $96,962.855.92 72.9% 79.7% $379,594,332.97 $77,123,811.52 79.79% 77.7% $391,819,413.51 $87,185,593.47 77.7% 78.0% $387,158,762.91 $85,014,575.74 78.0% 73.0% $366,099.403.38 $98,975,751.25 73.0% 77.7% $459,369,929.48 $102,484,415.45 77.7% 78.5% $446,195,408.35 $95,717,361.790 78.5% 62.8% $197.097,183.82 $73,312,606.05 62.8% 16.9% $97,218,411.73 $80,748,872.81 16.9% 76104 S340.0 741299 671 503322 111 51 76 104 17 2019 2018 2017 2016 2015 2014 2013 2012 2011 2010 2009 2008 2007 2006 2005 2004 2003 2002 2001 2000 1999 1998 1997 1996 1995 1994 1993 1992 1991 1990 1989 1988 1987 1986 1985 18 19 20 21 22 23 24 25 26 27 28 29 30 31 32 33 34 35 26 $335 262 610 37 3404C 766 661 178 192.nnnnnn 20 7504 76 1304 C 127 776 862 30 600 onn F1 fa . D E F 1 Movie 2 Captain Marvel 3 How to Train Your Dragon: The Hidde 4 Shazam! 5 Us 6 Glass 7 The LEGO Movie 2: The Second Part 8 The Upside 9 Wonder Park 10 Pet Sematary 11 What Men Want 12 Isn't it Romantic 13 The Kid Who Would Be King 14 Serenity 15 UglyDolls 16 Captive State 17 Kursk 18 Renegades 19 Avengers: Infinity War 20 Black Panther 21 Jurassic World: Fallen Kingdom 22 Incredibles 2 23 Aquaman 24 Bohemian Rhapsody 25 Venom 26 Mission: Impossible-Fallout 27 Deadpool 2 28 Fantastic Beasts: The Crimes of Grin 29 Ant-Man and the Wasp 30 Ready Player One 31 The Meg 32 Hotel Transylvania 3: Summer Vacati 33 Ralph Breaks The Internet 34 Dr. Seuss' The Grinch 35 Bumblebee 36 A Star is Born 37 Rampage 38 Solo: A Star Wars Story 39 Spider-Man: Into The Spider-Verse 3 40 Fifty Shades Freed 41 Peter Rabbit 42 Mary Poppins Returns 43 Green Book B Domestic Box Office Gross $420,774,262 $159,938,530 $135,453,748 $173,920,550 $111,035,005 $105,794,228 $108,235,497 $45,182,676 $53,812,146 $54,611,903 $48,779,382 $16,790,790 $8,547,045 $8,603,407 $5,958,315 $0 $0 $678,815,482 $700,059,566 $417,719,760 $608,581,744 $335,061,807 $216,303,339 $213,511,408 $220,159,104 $324,591,735 $159,555,901 $216,648,740 $137,690,172 $145,443,742 $167,500,092 $201,091,711 $270,620,950 $127,195,589 $215,288,866 $ 101,028,233 $213,767,512 $190, 173,195 $100,407,760 $115,234,093 $171,958,438 $85,080,171 Worldwide Box Office Gross $1,119,537,433 $517,020,877 $355,728,119 $251,896,080 $245,303,505 $190,571,051 $119,024,536 $111,856,609 $105,703,994 $69,911,903 $48,779,382 $28,535,978 $11,367,029 $9,558,407 $8,635,583 $4,212,799 $1,521,672 $2,048,134,200 $1,348,258,224 $1,305,772,799 $1,242,532,436 $1,146,894,640 $898,598,280 $853,628,605 $787,456,552 $786,680,557 $652,220,086 $623, 144,660 $579,290,136 $529,530,715 $527,077,678 $524,288,667 $511,008,279 $465,195,589 $433,480,232 $428,056,280 $393,151,347 $374,911,896 $371,350,619 $347,136,477 $343,804,158 $317,491,148 Production Cost $152,000,000 $129,000,000 $85,000,000 $24,600,000 $20,000,000 $99,000,000 $37,500,000 $100,000,000 $21,000,000 $20,000,000 $31,000,000 $59,000,000 $25,000,000 $45,000,000 $25,000,000 $40,000,000 $77,500,000 $300,000,000 $200,000,000 $170,000,000 $200,000,000 $160,000,000 $55,000,000 $116,000,000 $178,000,000 $110,000,000 $200,000,000 $130,000,000 $150,000,000 $178,000,000 $65,000,000 $175,000,000 $75,000,000 $102,000,000 $36,000,000 $120,000,000 $250,000,000 $90,000,000 $55,000,000 $50,000,000 $130,000,000 $28,900,000 Release Date 2019 2019 2019 2019 2019 2019 2019 2019 2019 2019 2019 2019 2019 2019 2019 2019 2019 2018 2018 2018 2018 2018 2018 2018 2018 2018 2018 2018 2018 2018 2018 2018 2018 2018 2018 2018 2018 2018 2018 2018 2018 2018 44 Son CCO 420 120 201102A COC non non 10Step by Step Solution
There are 3 Steps involved in it
1 Expert Approved Answer
Step: 1 Unlock

Question Has Been Solved by an Expert!
Get step-by-step solutions from verified subject matter experts
Step: 2 Unlock
Step: 3 Unlock