

Question: What would the graph look like? The graph is what im struggling with. Expected dividends as a basis for stock values The following graph shows
What would the graph look like? The graph is what im struggling with.
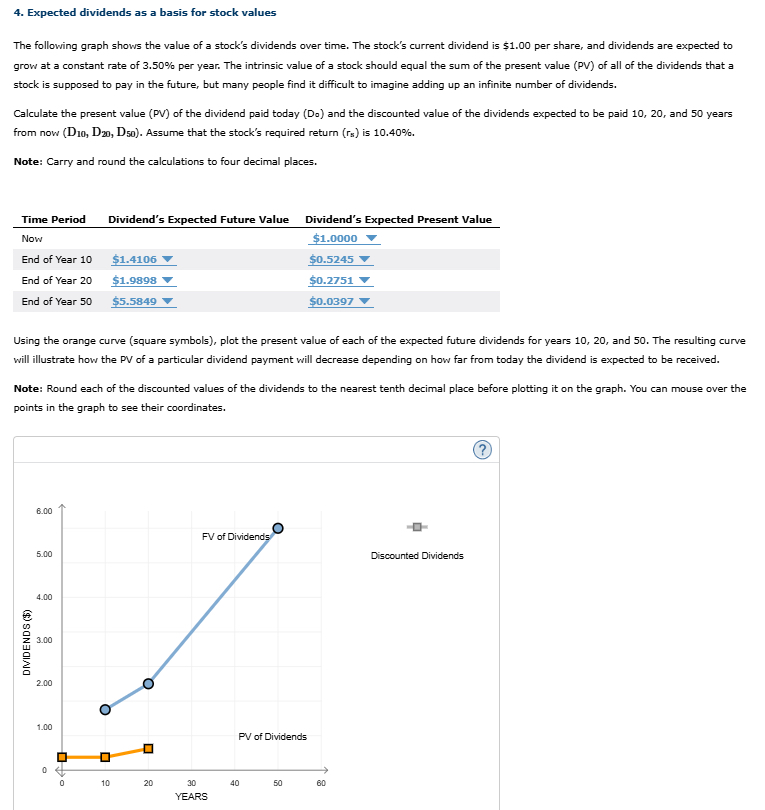
Expected dividends as a basis for stock values
The following graph shows the value of a stock's dividends over time. The stock's current dividend is $ per share, and dividends are expected to grow at a constant rate of per year. The intrinsic value of a stock should equal the sum of the present value PV of all of the dividends that a stock is supposed to pay in the future, but many people find it difficult to imagine adding up an infinite number of dividends.
Calculate the present value PV of the dividend paid today Do and the discounted value of the dividends expected to be paid and years from now Assume that the stock's required return is
Note: Carry and round the calculations to four decimal places.
tableTime Period,Dividend's Expected Future Value,Dividend's Expected Present ValueNow$
Step by Step Solution
There are 3 Steps involved in it
1 Expert Approved Answer
Step: 1 Unlock

Question Has Been Solved by an Expert!
Get step-by-step solutions from verified subject matter experts
Step: 2 Unlock
Step: 3 Unlock